

Өзекті паттерндер

Бычий вымпел
сформирован 26.03 в 12:13:21 (UTC+0)
сила сигнала 2 из 5
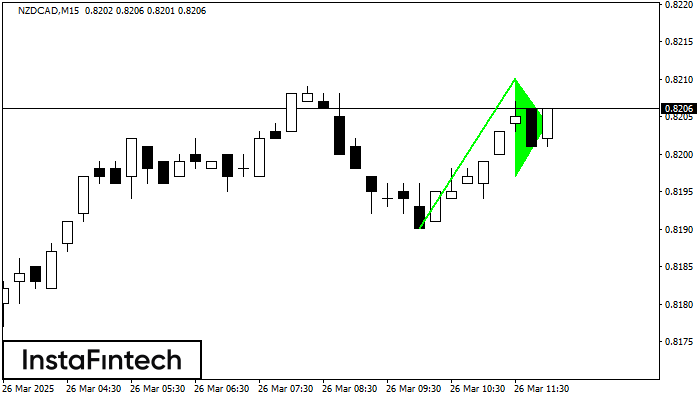
На графике NZDCAD M15 сформировался паттерн «Бычий вымпел», который относится к фигуре продолжения тренда. Можно предполагать, что, в случае фиксации цены выше максимума вымпела 0.8210, возможно дальнейшее восходящее движение.
Таймфреймы М5 и М15 могут иметь больше ложных точек входа.
- Все
- Все
- Bearish Rectangle
- Bearish Symmetrical Triangle
- Bearish Symmetrical Triangle
- Bullish Rectangle
- Double Top
- Double Top
- Triple Bottom
- Triple Bottom
- Triple Top
- Triple Top
- Все
- Все
- Покупка
- Продажа
- Все
- 1
- 2
- 3
- 4
- 5
Bullish Symmetrical Triangle
сформирован 14.05 в 05:06:03 (UTC+0)
сила сигнала 1 из 5
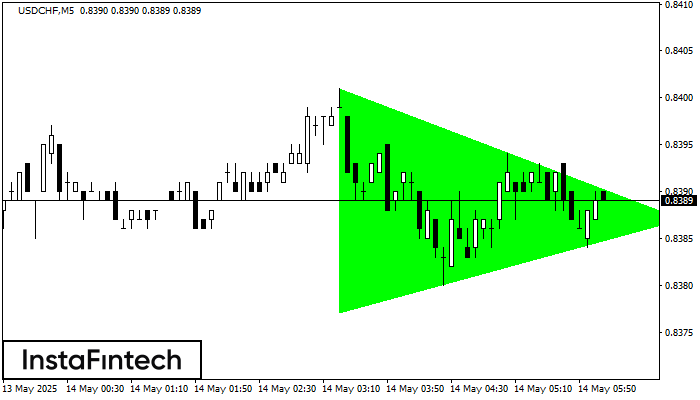
According to the chart of M5, USDCHF formed the Bullish Symmetrical Triangle pattern. Description: This is the pattern of a trend continuation. 0.8401 and 0.8377 are the coordinates
The M5 and M15 time frames may have more false entry points.
Открыть график инструмента в новом окне
Double Bottom
сформирован 14.05 в 04:40:12 (UTC+0)
сила сигнала 1 из 5
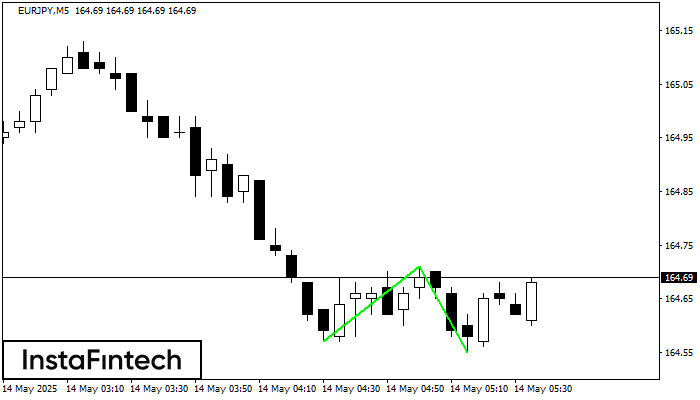
The Double Bottom pattern has been formed on EURJPY M5; the upper boundary is 164.71; the lower boundary is 164.55. The width of the pattern is 14 points. In case
The M5 and M15 time frames may have more false entry points.
Открыть график инструмента в новом окне
Double Bottom
сформирован 14.05 в 04:15:37 (UTC+0)
сила сигнала 2 из 5
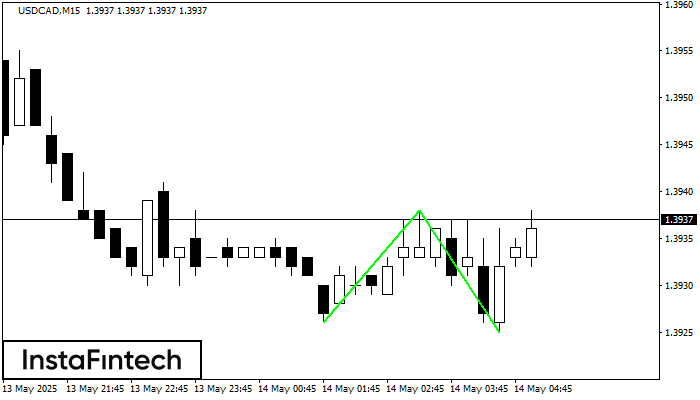
The Double Bottom pattern has been formed on USDCAD M15; the upper boundary is 1.3938; the lower boundary is 1.3925. The width of the pattern is 12 points. In case
The M5 and M15 time frames may have more false entry points.
Открыть график инструмента в новом окне


