

Өзекті паттерндер

Тройная вершина
сформирован 25.03 в 03:55:23 (UTC+0)
сила сигнала 1 из 5
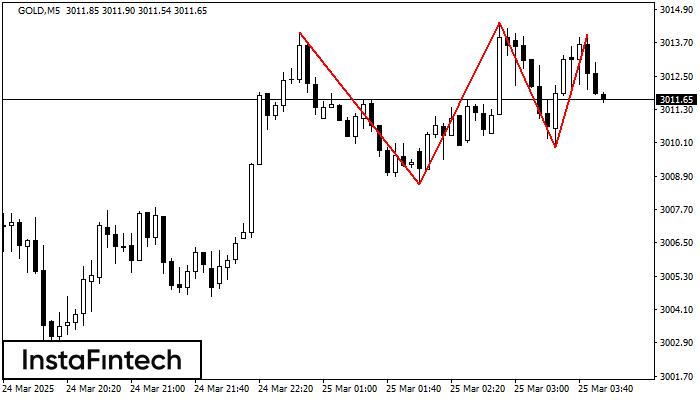
На графике GOLD M5 образовалась фигура «Тройная вершина». Данная фигура относится к типу разворотных и имеет характеристику: Верхняя граница 3014.06/3014.01; Нижняя граница 3008.62/3009.95; Ширина фигуры 449 пунктов. Прогноз: В случае пробоя нижней границы 3008.62 вероятно дальнейшее нисходящее движение к уровню 3014.29.
Таймфреймы М5 и М15 могут иметь больше ложных точек входа.
Сондай-ақ қараңыз
- Все
- Все
- Bearish Rectangle
- Bearish Symmetrical Triangle
- Bearish Symmetrical Triangle
- Bullish Rectangle
- Double Top
- Double Top
- Triple Bottom
- Triple Bottom
- Triple Top
- Triple Top
- Все
- Все
- Покупка
- Продажа
- Все
- 1
- 2
- 3
- 4
- 5
Бычий симметричный треугольник
сформирован 21.04 в 22:46:45 (UTC+0)
сила сигнала 1 из 5

По #Bitcoin на M5 сформировалась фигура «Бычий симметричный треугольник», которая сигнализирует нам о продолжении тенденции. Характеристика: Верхняя граница фигуры имеет координаты 88419.31/87233.62; Нижняя граница 85751.59/87233.62; Проекция ширины фигуры 266772 пунктов
Таймфреймы М5 и М15 могут иметь больше ложных точек входа.
Открыть график инструмента в новом окне
Двойная вершина
сформирован 21.04 в 22:26:30 (UTC+0)
сила сигнала 1 из 5

По AUDCAD на M5 сформировалась разворотная фигура «Двойная вершина». Характеристика: Верхняя граница 0.8880; Нижняя граница 0.8869; Ширина фигуры 11 пунктов. Позицию на продажу возможно открыть ниже нижней границы 0.8869
Таймфреймы М5 и М15 могут иметь больше ложных точек входа.
Открыть график инструмента в новом окне
Тройное дно
сформирован 21.04 в 22:01:24 (UTC+0)
сила сигнала 3 из 5

Сформирована фигура «Тройное дно» по торговому инструменту USDJPY на M30. Фигура сигнализирует об изменении тенденции с нисходящей на восходящую в случае пробоя верхней границы 141.05
Открыть график инструмента в новом окне


