

Өзекті паттерндер

Двойная вершина
сформирован 25.03 в 01:00:30 (UTC+0)
сила сигнала 3 из 5
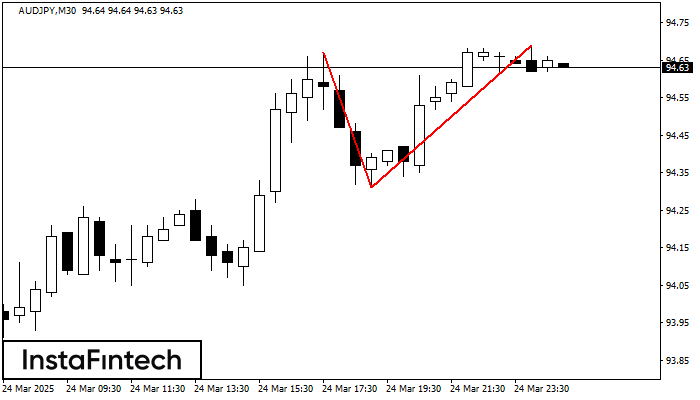
На торговом графике AUDJPY M30 сформировалась разворотная фигура «Двойная вершина». Характеристика: Верхняя граница 94.69; Нижняя граница 94.31; Ширина фигуры 38 пунктов. Сигнал: Пробой нижней границы 94.31 приведет к дальнейшему нисходящему движению с перспективой хода к уровню 94.01.
Сондай-ақ қараңыз
- Все
- Все
- Bearish Rectangle
- Bearish Symmetrical Triangle
- Bearish Symmetrical Triangle
- Bullish Rectangle
- Double Top
- Double Top
- Triple Bottom
- Triple Bottom
- Triple Top
- Triple Top
- Все
- Все
- Покупка
- Продажа
- Все
- 1
- 2
- 3
- 4
- 5
Bearish pennant
сформирован 05.05 в 15:32:00 (UTC+0)
сила сигнала 3 из 5
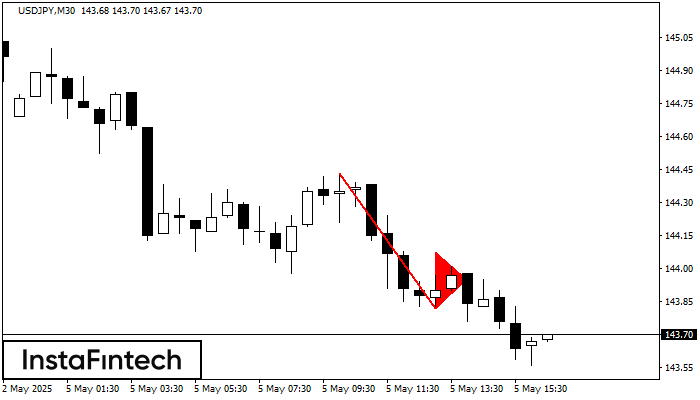
The Bearish pennant pattern has formed on the USDJPY M30 chart. The pattern signals continuation of the downtrend in case the pennant’s low of 143.82 is broken through. Recommendations: Place
Открыть график инструмента в новом окне
Double Top
сформирован 05.05 в 14:24:52 (UTC+0)
сила сигнала 1 из 5
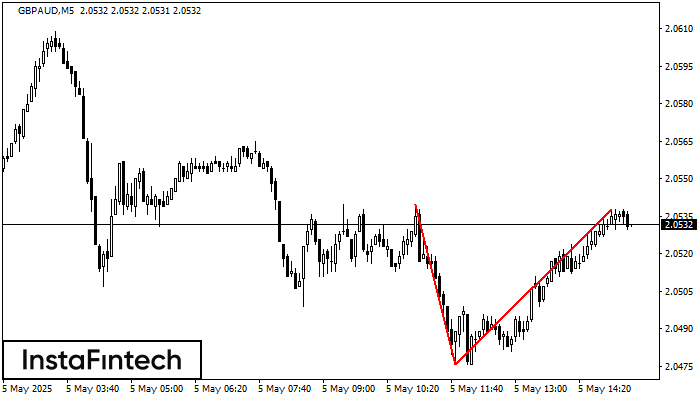
On the chart of GBPAUD M5 the Double Top reversal pattern has been formed. Characteristics: the upper boundary 2.0538; the lower boundary 2.0476; the width of the pattern 62 points
The M5 and M15 time frames may have more false entry points.
Открыть график инструмента в новом окне
Bullish Symmetrical Triangle
сформирован 05.05 в 14:15:38 (UTC+0)
сила сигнала 1 из 5
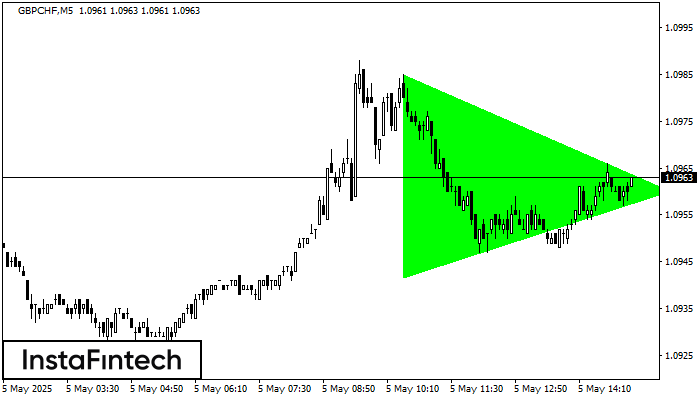
According to the chart of M5, GBPCHF formed the Bullish Symmetrical Triangle pattern, which signals the trend will continue. Description. The upper border of the pattern touches the coordinates 1.0985/1.0960
The M5 and M15 time frames may have more false entry points.
Открыть график инструмента в новом окне


