

Өзекті паттерндер

Двойное дно
сформирован 21.03 в 03:15:41 (UTC+0)
сила сигнала 2 из 5
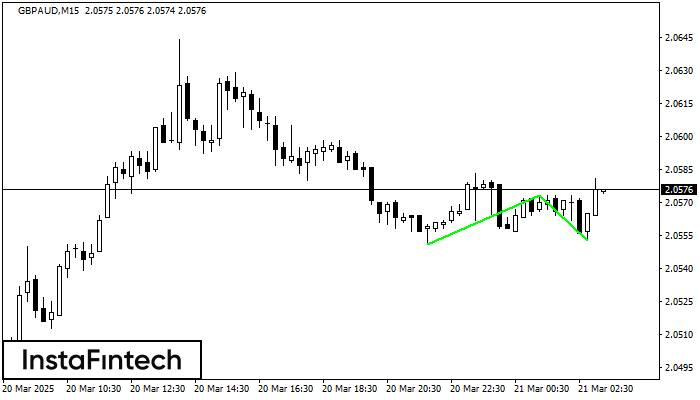
Сформирована фигура «Двойное дно» на графике GBPAUD M15. Верхняя граница 2.0573; Нижняя граница 2.0553; Ширина фигуры 22 пунктов. В случае пробоя верхней границы 2.0573 можно будет прогнозировать изменение тенденции, где ширина фигуры и будет являться расстоянием предположительного Тейк Профита.
Таймфреймы М5 и М15 могут иметь больше ложных точек входа.
- Все
- Все
- Bearish Rectangle
- Bearish Symmetrical Triangle
- Bearish Symmetrical Triangle
- Bullish Rectangle
- Double Top
- Double Top
- Triple Bottom
- Triple Bottom
- Triple Top
- Triple Top
- Все
- Все
- Покупка
- Продажа
- Все
- 1
- 2
- 3
- 4
- 5
Double Bottom
was formed on 06.05 at 21:35:15 (UTC+0)
signal strength 1 of 5
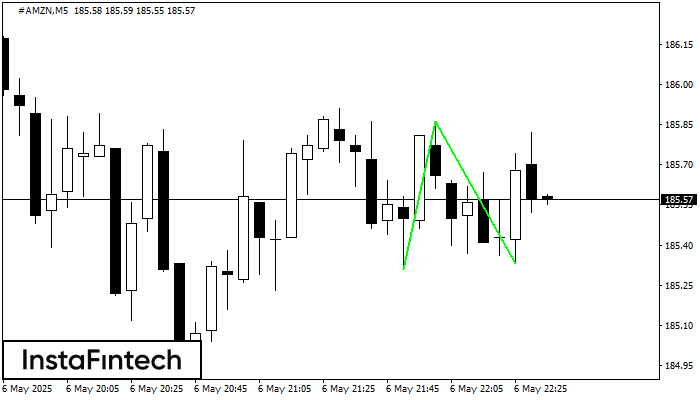
The Double Bottom pattern has been formed on #AMZN M5. Characteristics: the support level 185.31; the resistance level 185.86; the width of the pattern 55 points. If the resistance level
The M5 and M15 time frames may have more false entry points.
Open chart in a new window
Bullish Symmetrical Triangle
was formed on 06.05 at 21:02:39 (UTC+0)
signal strength 1 of 5
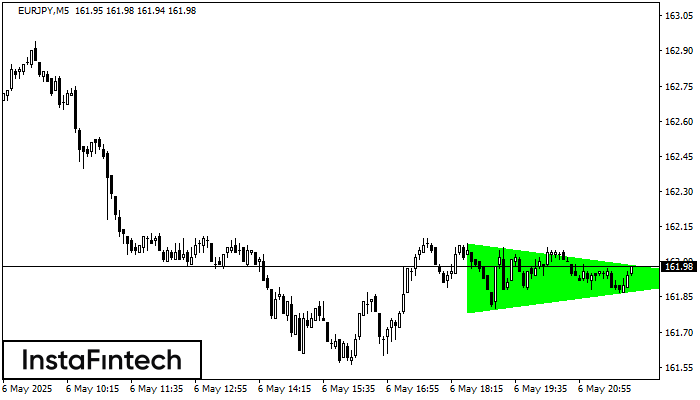
According to the chart of M5, EURJPY formed the Bullish Symmetrical Triangle pattern. Description: This is the pattern of a trend continuation. 162.08 and 161.78 are the coordinates
The M5 and M15 time frames may have more false entry points.
Open chart in a new window
Bullish Rectangle
was formed on 06.05 at 21:00:23 (UTC+0)
signal strength 3 of 5
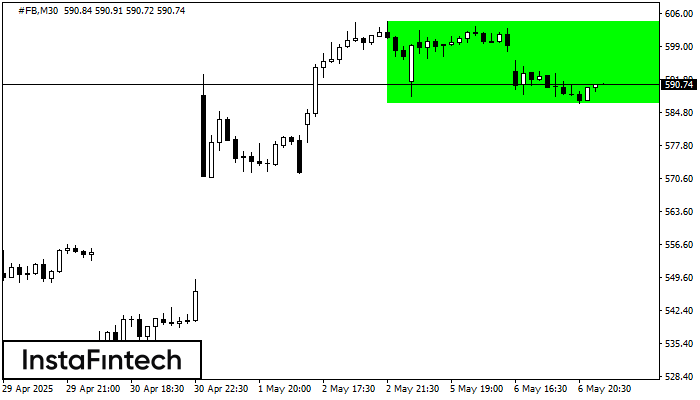
According to the chart of M30, #FB formed the Bullish Rectangle. This type of a pattern indicates a trend continuation. It consists of two levels: resistance 604.25 and support 586.62
Open chart in a new window


