

Өзекті паттерндер

Актуальные паттерны
- Все
- Все
- Bearish Rectangle
- Bearish Symmetrical Triangle
- Bearish Symmetrical Triangle
- Bullish Rectangle
- Double Top
- Double Top
- Triple Bottom
- Triple Bottom
- Triple Top
- Triple Top
- Все
- Все
- Покупка
- Продажа
- Все
- 1
- 2
- 3
- 4
- 5
Double Bottom
was formed on 15.04 at 20:20:27 (UTC+0)
signal strength 1 of 5
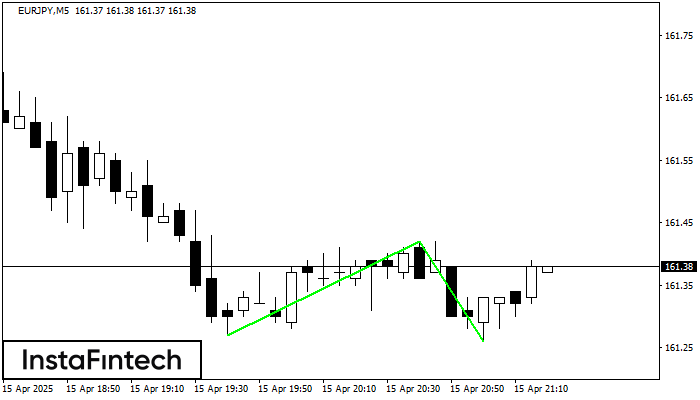
The Double Bottom pattern has been formed on EURJPY M5. Characteristics: the support level 161.27; the resistance level 161.42; the width of the pattern 15 points. If the resistance level
The M5 and M15 time frames may have more false entry points.
Open chart in a new window
Bearish Symmetrical Triangle
was formed on 15.04 at 20:14:46 (UTC+0)
signal strength 1 of 5
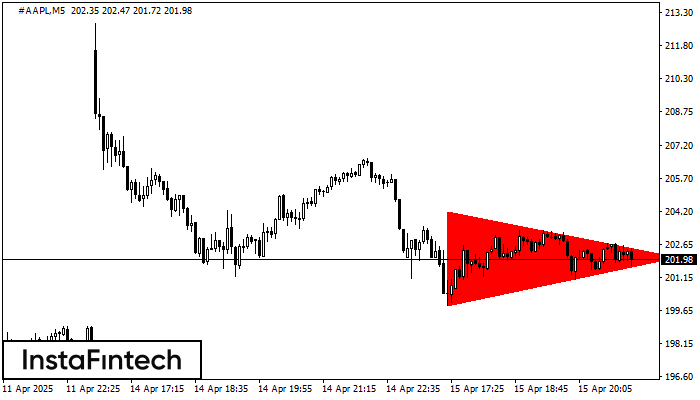
According to the chart of M5, #AAPL formed the Bearish Symmetrical Triangle pattern. Trading recommendations: A breach of the lower border 199.85 is likely to encourage a continuation
The M5 and M15 time frames may have more false entry points.
Open chart in a new window
Triple Top
was formed on 15.04 at 20:05:22 (UTC+0)
signal strength 1 of 5
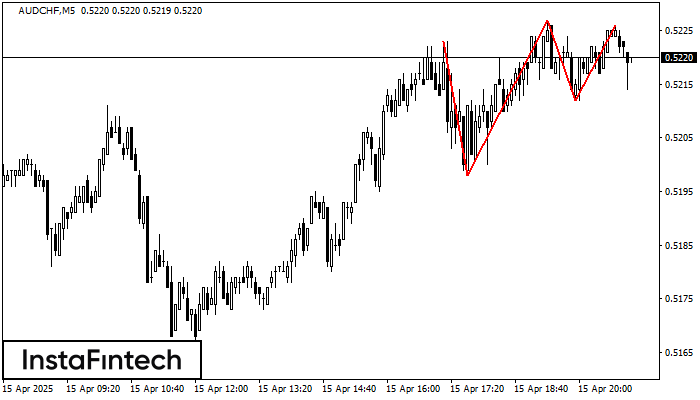
The Triple Top pattern has formed on the chart of the AUDCHF M5. Features of the pattern: borders have an ascending angle; the lower line of the pattern
The M5 and M15 time frames may have more false entry points.
Open chart in a new window


