

Actual patterns

Patterns are graphical models which are formed in the chart by the price. According to one of the technical analysis postulates, history (price movement) repeats itself. It means that the price movements are often similar in the same situations which makes it possible to predict the further development of the situation with a high probability.
Relevant patterns by InstaTrade is an easy-to-use service which allows you to be aware of latest changes in the market and react to clues from the market in time. In our service you will always find the latest and most relevant patterns on any pair and any timeframe.
Double Bottom
was formed on 15.04 at 21:15:37 (UTC+0)
signal strength 2 of 5
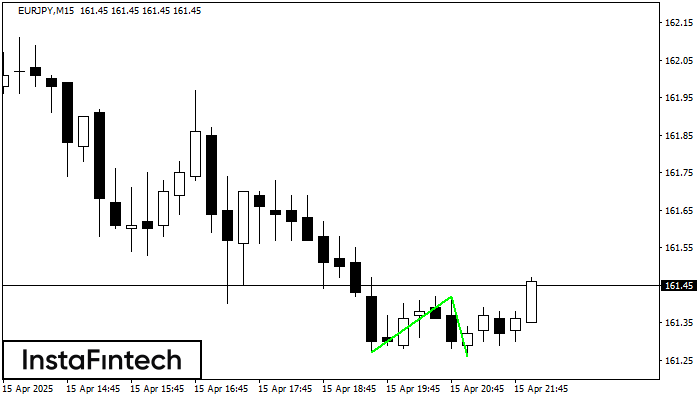
The Double Bottom pattern has been formed on EURJPY M15; the upper boundary is 161.42; the lower boundary is 161.26. The width of the pattern is 15 points. In case of a break of the upper boundary 161.42, a change in the trend can be predicted where the width of the pattern will coincide with the distance to a possible take profit level.
The M5 and M15 time frames may have more false entry points.
See Also
- All
- All
- Bearish Rectangle
- Bearish Symmetrical Triangle
- Bearish Symmetrical Triangle
- Bullish Rectangle
- Double Top
- Double Top
- Triple Bottom
- Triple Bottom
- Triple Top
- Triple Top
- All
- All
- Buy
- Sale
- All
- 1
- 2
- 3
- 4
- 5
Bawah Triple
was formed on 06.05 at 03:00:35 (UTC+0)
signal strength 4 of 5

Pola Bawah Triple telah terbentuk pada GBPCHF H1. Pola tersebut memiliki karakteristik sebagai berikut: level resistance 1.0997/1.0988; level support 1.0919/1.0919; dengan lebar 78 poin. Jika terjadi pemecahan (breakdown) pada level
Open chart in a new window
Bawah Triple
was formed on 06.05 at 03:00:33 (UTC+0)
signal strength 4 of 5
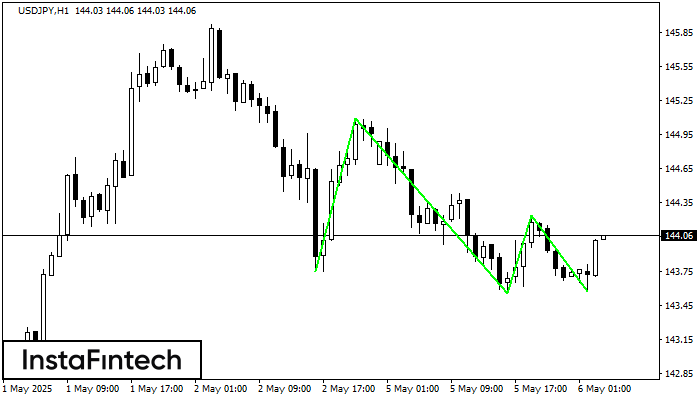
Pola Bawah Triple telah terbentuk pada grafik USDJPY H1. Fitur-fitur pola: garis bawah pola memiliki koordinat 145.09 dengan batas atas 145.09/144.24, proyeksi lebar adalah 134 poin. Pembentukan pola Bawah Triple
Open chart in a new window
Bawah Triple
was formed on 06.05 at 03:00:33 (UTC+0)
signal strength 4 of 5
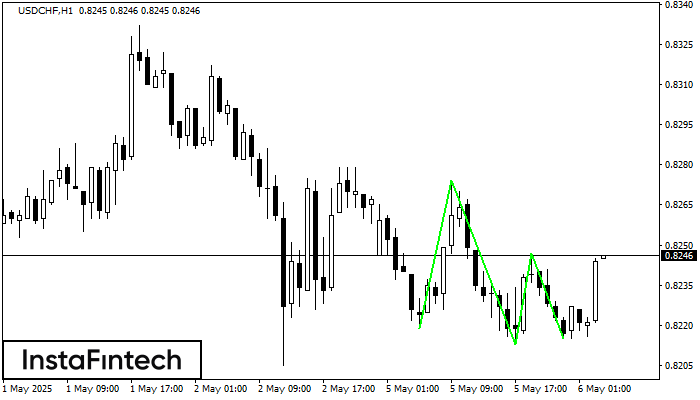
Pola Bawah Triple telah terbentuk pada grafik instrumen trading USDCHF H1. Pola tersebut menandakan perubahan dalam trend dari menurun menjadi naik jika terjadi pemecahan (breakdown) 0.8274/0.8247
Open chart in a new window


