

Actual patterns

Patterns are graphical models which are formed in the chart by the price. According to one of the technical analysis postulates, history (price movement) repeats itself. It means that the price movements are often similar in the same situations which makes it possible to predict the further development of the situation with a high probability.
Relevant patterns by InstaTrade is an easy-to-use service which allows you to be aware of latest changes in the market and react to clues from the market in time. In our service you will always find the latest and most relevant patterns on any pair and any timeframe.
Bearish pennant
was formed on 07.04 at 00:00:21 (UTC+0)
signal strength 2 of 5
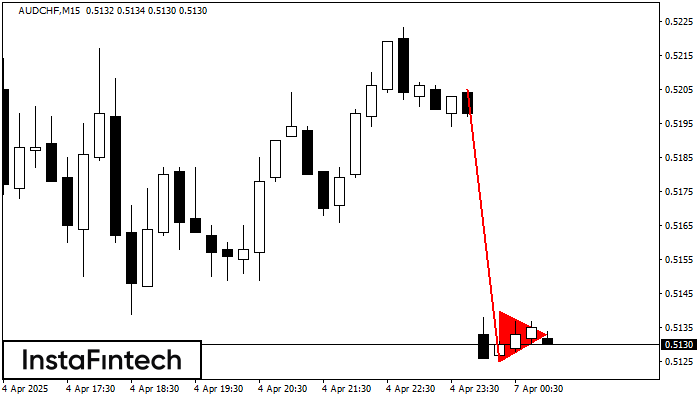
The Bearish pennant pattern has formed on the AUDCHF M15 chart. It signals potential continuation of the existing trend. Specifications: the pattern’s bottom has the coordinate of 0.5125; the projection of the flagpole height is equal to 80 pips. In case the price breaks out the pattern’s bottom of 0.5125, the downtrend is expected to continue for further level 0.5102.
The M5 and M15 time frames may have more false entry points.
See Also
- All
- All
- Bearish Rectangle
- Bearish Symmetrical Triangle
- Bearish Symmetrical Triangle
- Bullish Rectangle
- Double Top
- Double Top
- Triple Bottom
- Triple Bottom
- Triple Top
- Triple Top
- All
- All
- Buy
- Sale
- All
- 1
- 2
- 3
- 4
- 5
รูปแบบกราฟจุดสองยอด (Double Top)
was formed on 08.05 at 22:00:42 (UTC+0)
signal strength 2 of 5
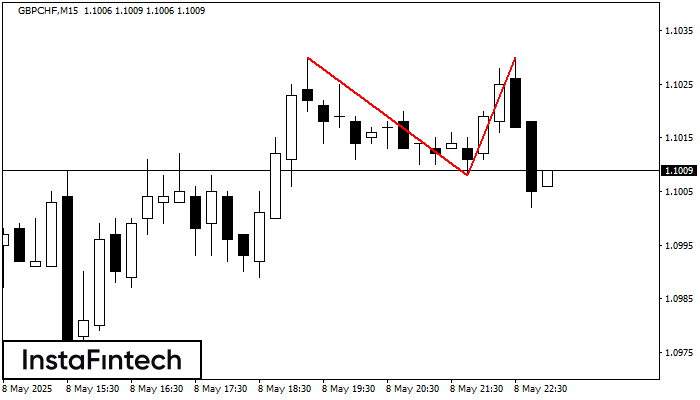
รูปแบบ รูปแบบกราฟจุดสองยอด (Double Top) ถูกสร้างขึ้นมาใน GBPCHF M15 มันแสดงให้เห็นว่า แนวโน้มได้มีการเปลี่ยนแปลงจากแนวโน้มขาขึ้น ไปเป็นขาลง บางที ถ้ามีการเคลื่อนตัวทะลุผ่าน ฐานของรูปแบบออกไป 1.1008 การเคลื่อนไหวลงด้านล่างจะยังคงเกิดขึ้น
ขอบเตระยะเวลาใน M5 และ M15 อาจจะมีตำแหน่งการเข้าใช้งานที่ผิดพลาดมากยิ่งขึ้น
Open chart in a new window
รูปแบบกราฟจุดสามยอด (Triple Top)
was formed on 08.05 at 21:45:13 (UTC+0)
signal strength 1 of 5
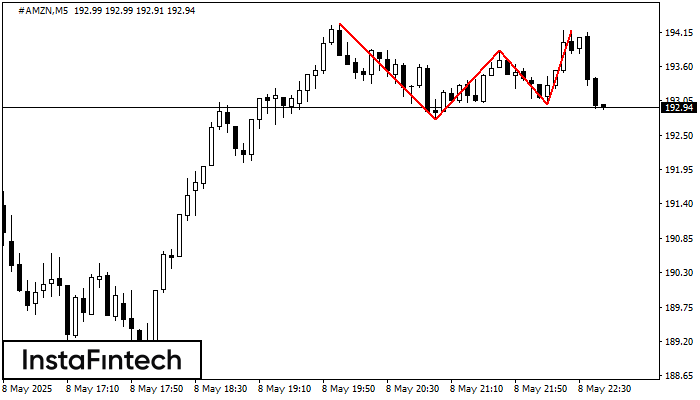
ในชาร์ตของตราสารการซื้อขาย #AMZN M5 กราฟรูปแบบ รูปแบบกราฟจุดสามยอด (Triple Top) ที่แสดงให้เห็นถึง การเปลี่ยนแปลงของแนวโน้มที่ถูกสร้างขึ้นมา มันเป็นไปได้ที่ หลังจากการก่อตัวของระดับสูงสุดอันดับสามมาแล้ว ราคาจะพยายามเคลื่อนตัวทะลุผ่านระดับของแนวต้าน 192.76 ที่พวกเราแนะนำให้เปิดสถานะการเทรดไว้เพื่อเป็นการขาย ตำแหน่งการทำกำไรเป็นระยะทางของความกว้างในกราฟรูปแบบนี้
ขอบเตระยะเวลาใน M5 และ M15 อาจจะมีตำแหน่งการเข้าใช้งานที่ผิดพลาดมากยิ่งขึ้น
Open chart in a new window
รูปแบบกราฟจุดสองยอด (Double Top)
was formed on 08.05 at 21:45:13 (UTC+0)
signal strength 2 of 5
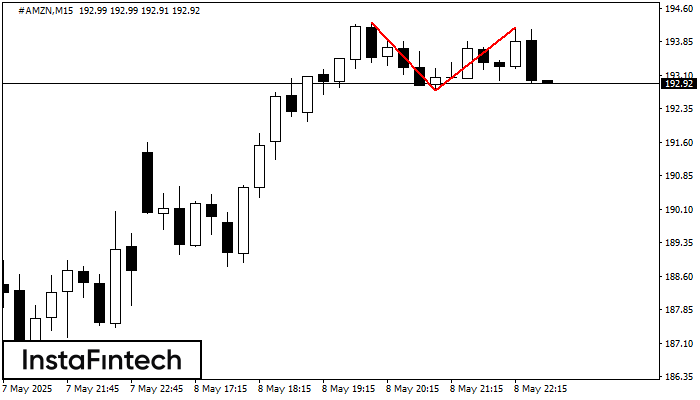
ในชาร์ตของ #AMZN M15 พบว่า กราฟรูปแบบย้อนกลับ รูปแบบกราฟจุดสองยอด (Double Top) ได้ถูกสร้างขึ้นมา คุณลักษณะ: ขอบเขตด้านบน 194.18; ขอบเขตด้านล่าง 192.76; ความกว้างของกราฟรูปแบบนี้คือ
ขอบเตระยะเวลาใน M5 และ M15 อาจจะมีตำแหน่งการเข้าใช้งานที่ผิดพลาดมากยิ่งขึ้น
Open chart in a new window


