

Actual patterns

Patterns are graphical models which are formed in the chart by the price. According to one of the technical analysis postulates, history (price movement) repeats itself. It means that the price movements are often similar in the same situations which makes it possible to predict the further development of the situation with a high probability.
Relevant patterns by InstaTrade is an easy-to-use service which allows you to be aware of latest changes in the market and react to clues from the market in time. In our service you will always find the latest and most relevant patterns on any pair and any timeframe.
Bullish Rectangle
was formed on 02.04 at 05:02:20 (UTC+0)
signal strength 1 of 5
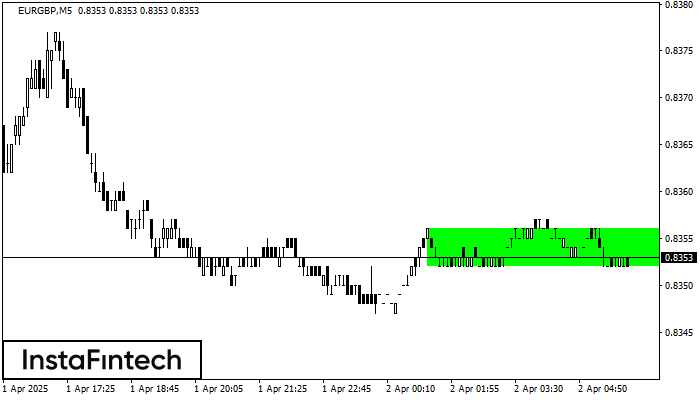
According to the chart of M5, EURGBP formed the Bullish Rectangle. The pattern indicates a trend continuation. The upper border is 0.8356, the lower border is 0.8352. The signal means that a long position should be opened above the upper border 0.8356 of the Bullish Rectangle.
The M5 and M15 time frames may have more false entry points.
See Also
- All
- All
- Bearish Rectangle
- Bearish Symmetrical Triangle
- Bearish Symmetrical Triangle
- Bullish Rectangle
- Double Top
- Double Top
- Triple Bottom
- Triple Bottom
- Triple Top
- Triple Top
- All
- All
- Buy
- Sale
- All
- 1
- 2
- 3
- 4
- 5
Teratas Ganda
was formed on 21.04 at 22:26:30 (UTC+0)
signal strength 1 of 5

Pola reversal Teratas Ganda telah terbentuk pada AUDCAD M5. Karakteristik: batas atas 0.8880; batas bawah 0.8869; lebar pola 11 poin. Transaksi jual lebih baik dibuka di bawah batas bawah 0.8869
Rangka waktu M5 dan M15 mungkin memiliki lebih dari titik entri yang keliru.
Open chart in a new window
Bawah Triple
was formed on 21.04 at 22:01:24 (UTC+0)
signal strength 3 of 5

Pola Bawah Triple telah terbentuk pada grafik instrumen trading USDJPY M30. Pola tersebut menandakan perubahan dalam trend dari menurun menjadi naik jika terjadi pemecahan (breakdown) 141.08/141.05
Open chart in a new window
Bawah Ganda
was formed on 21.04 at 22:00:49 (UTC+0)
signal strength 4 of 5

Pola Bawah Ganda telah terbentuk pada AUDCHF H1; batas atas di 0.5198; batas bawah di 0.5165. Lebar pola sebesar 34 poin. Jika harga menembus batas atas 0.5198, Perubahan dalam tren
Open chart in a new window


