

Actual patterns

Patterns are graphical models which are formed in the chart by the price. According to one of the technical analysis postulates, history (price movement) repeats itself. It means that the price movements are often similar in the same situations which makes it possible to predict the further development of the situation with a high probability.
Relevant patterns by InstaTrade is an easy-to-use service which allows you to be aware of latest changes in the market and react to clues from the market in time. In our service you will always find the latest and most relevant patterns on any pair and any timeframe.
Double Top
was formed on 21.03 at 02:31:16 (UTC+0)
signal strength 2 of 5
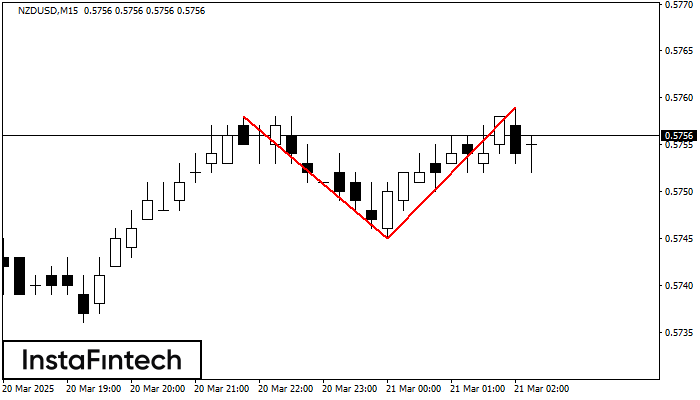
On the chart of NZDUSD M15 the Double Top reversal pattern has been formed. Characteristics: the upper boundary 0.5759; the lower boundary 0.5745; the width of the pattern 14 points. The signal: a break of the lower boundary will cause continuation of the downward trend targeting the 0.5723 level.
The M5 and M15 time frames may have more false entry points.
- All
- All
- Bearish Rectangle
- Bearish Symmetrical Triangle
- Bearish Symmetrical Triangle
- Bullish Rectangle
- Double Top
- Double Top
- Triple Bottom
- Triple Bottom
- Triple Top
- Triple Top
- All
- All
- Buy
- Sale
- All
- 1
- 2
- 3
- 4
- 5
Triple Bottom
was formed on 02.05 at 22:50:22 (UTC+0)
signal strength 1 of 5

Corak Triple Bottom telah dibentuk pada EURGBP M5. Ia mempunyai ciri-ciri berikut: tahap rintangan 0.8515/0.8514; tahap sokongan 0.8509/0.8509; lebar corak adalah 6 mata. Dalam situasi penembusan paras rintangan 0.8515, harga
Carta masa M5 dan M15 mungkin mempunyai lebih banyak titik kemasukan palsu.
Open chart in a new window
Double Top
was formed on 02.05 at 21:50:15 (UTC+0)
signal strength 1 of 5

Corak pembalikan Double Top telah dibentuk pada USDJPY M5. Ciri-ciri: sempadan atas %P0.000000; sempadan bawah 145.09; sempadan bawah 144.90; lebar corak adalah 18 mata. Dagangan menjual adalah lebih baik untuk
Carta masa M5 dan M15 mungkin mempunyai lebih banyak titik kemasukan palsu.
Open chart in a new window
Triple Bottom
was formed on 02.05 at 21:45:21 (UTC+0)
signal strength 1 of 5

Corak Triple Bottom telah dibentuk pada EURGBP M5. Ia mempunyai ciri-ciri berikut: tahap rintangan 0.8515/0.8514; tahap sokongan 0.8509/0.8509; lebar corak adalah 6 mata. Dalam situasi penembusan paras rintangan 0.8515, harga
Carta masa M5 dan M15 mungkin mempunyai lebih banyak titik kemasukan palsu.
Open chart in a new window


