

वास्तविक पैटर्न

पैटर्न ग्राफिकल मॉडल हैं जो चार्ट में मूल्य से बने होते हैं। तकनीकी विश्लेषण भविष्यवाणियों में से एक के अनुसार, इतिहास का मतलब मूल्य आंदोलन खुद को दोहराता है। इसका मतलब है कि मूल्य आंदोलन अक्सर एक ही परिस्थितियों में समान होते हैं जो उच्च संभावना के साथ स्थिति के आगे के विकास की भविष्यवाणी करना संभव बनाता है।
इंस्टा फॉरेक्स द्वारा प्रासंगिक पैटर्न एक उपयोग में आसान सेवा है जो आपको बाजार में नवीनतम परिवर्तनों के बारे में जागरूक होने और समय पर बाजार से संकेतों पर प्रतिक्रिया करने की अनुमति देती है। हमारी सेवा में आप हमेशा किसी भी जोड़ी और किसी भी समय सीमा पर नवीनतम और सबसे प्रासंगिक पैटर्न प्राप्त कर सकते हैं.
Bullish Symmetrical Triangle
was formed on 21.04 at 04:56:25 (UTC+0)
signal strength 1 of 5

According to the chart of M5, AUDCAD formed the Bullish Symmetrical Triangle pattern, which signals the trend will continue. Description. The upper border of the pattern touches the coordinates 0.8838/0.8828 whereas the lower border goes across 0.8815/0.8828. The pattern width is measured on the chart at 23 pips. If the Bullish Symmetrical Triangle pattern is in progress during the upward trend, this indicates the current trend will go on. In case 0.8828 is broken, the price could continue its move toward 0.8843.
The M5 and M15 time frames may have more false entry points.
- All
- All
- Bearish Rectangle
- Bearish Symmetrical Triangle
- Bearish Symmetrical Triangle
- Bullish Rectangle
- Double Top
- Double Top
- Triple Bottom
- Triple Bottom
- Triple Top
- Triple Top
- All
- All
- Buy
- Sale
- All
- 1
- 2
- 3
- 4
- 5
Doble Piso
was formed on 02.05 at 10:41:00 (UTC+0)
signal strength 1 of 5

El patrón Doble Piso ha sido formado en EURCHF M5. Características: el nivel de soporte 0.9361; el nivel de resistencia 0.9382; el ancho del patrón 21 puntos. Si el nivel
Los marcos de tiempo M5 y M15 pueden tener más puntos de entrada falsos.
Open chart in a new window
Doble Techo
was formed on 02.05 at 10:31:38 (UTC+0)
signal strength 3 of 5
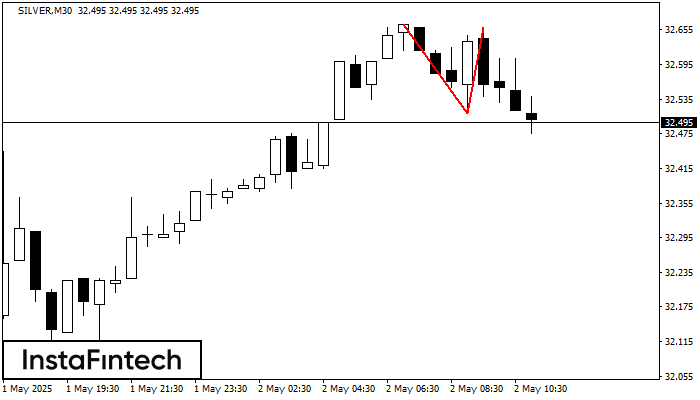
En el gráfico de SILVER M30 el patrón de reversión Doble Techo ha sido formado. Características: límite superior 32.66; límite inferior 32.51; el ancho del patrón 150 puntos. La señal
Open chart in a new window
Triángulo Simétrico Bajista
was formed on 02.05 at 09:51:53 (UTC+0)
signal strength 2 of 5
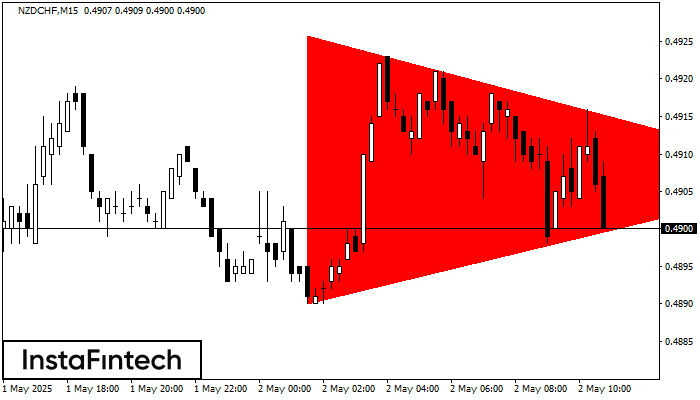
Según el gráfico de M15, el NZDCHF formó el patrón Triángulo Simétrico Bajista. Descripción: El límite inferior es 0.4890/0.4907 y el límite superior es 0.4926/0.4907. El ancho del patrón
Los marcos de tiempo M5 y M15 pueden tener más puntos de entrada falsos.
Open chart in a new window


