

वास्तविक पैटर्न

पैटर्न ग्राफिकल मॉडल हैं जो चार्ट में मूल्य से बने होते हैं। तकनीकी विश्लेषण भविष्यवाणियों में से एक के अनुसार, इतिहास का मतलब मूल्य आंदोलन खुद को दोहराता है। इसका मतलब है कि मूल्य आंदोलन अक्सर एक ही परिस्थितियों में समान होते हैं जो उच्च संभावना के साथ स्थिति के आगे के विकास की भविष्यवाणी करना संभव बनाता है।
इंस्टा फॉरेक्स द्वारा प्रासंगिक पैटर्न एक उपयोग में आसान सेवा है जो आपको बाजार में नवीनतम परिवर्तनों के बारे में जागरूक होने और समय पर बाजार से संकेतों पर प्रतिक्रिया करने की अनुमति देती है। हमारी सेवा में आप हमेशा किसी भी जोड़ी और किसी भी समय सीमा पर नवीनतम और सबसे प्रासंगिक पैटर्न प्राप्त कर सकते हैं.
Bearish Rectangle
was formed on 18.04 at 21:51:06 (UTC+0)
signal strength 2 of 5

According to the chart of M15, NZDCAD formed the Bearish Rectangle. This type of a pattern indicates a trend continuation. It consists of two levels: resistance 0.8222 - 0.0000 and support 0.8206 – 0.8206. In case the resistance level 0.8206 - 0.8206 is broken, the instrument is likely to follow the bearish trend.
The M5 and M15 time frames may have more false entry points.
- All
- All
- Bearish Rectangle
- Bearish Symmetrical Triangle
- Bearish Symmetrical Triangle
- Bullish Rectangle
- Double Top
- Double Top
- Triple Bottom
- Triple Bottom
- Triple Top
- Triple Top
- All
- All
- Buy
- Sale
- All
- 1
- 2
- 3
- 4
- 5
Bearish Rectangle
was formed on 02.05 at 07:29:15 (UTC+0)
signal strength 1 of 5
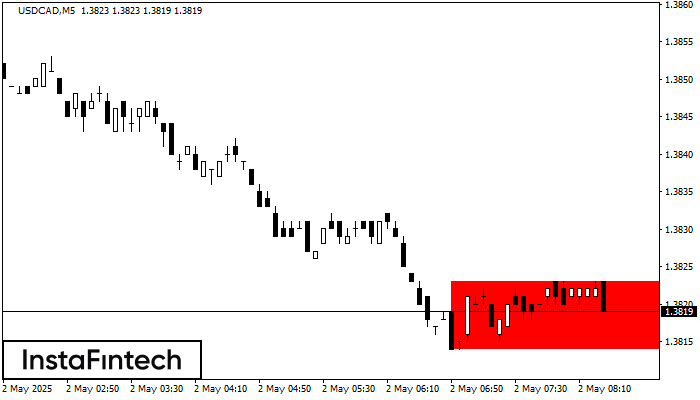
According to the chart of M5, USDCAD formed the Bearish Rectangle which is a pattern of a trend continuation. The pattern is contained within the following borders: lower border 1.3814
The M5 and M15 time frames may have more false entry points.
Open chart in a new window
Bearish Symmetrical Triangle
was formed on 02.05 at 06:54:22 (UTC+0)
signal strength 1 of 5
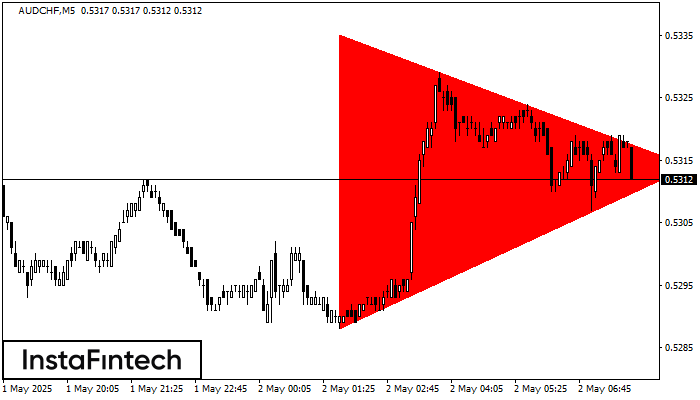
According to the chart of M5, AUDCHF formed the Bearish Symmetrical Triangle pattern. Trading recommendations: A breach of the lower border 0.5288 is likely to encourage a continuation
The M5 and M15 time frames may have more false entry points.
Open chart in a new window
Double Top
was formed on 02.05 at 06:30:42 (UTC+0)
signal strength 3 of 5
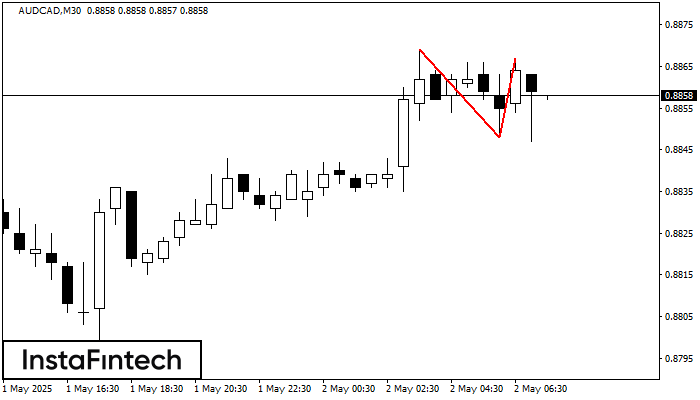
The Double Top pattern has been formed on AUDCAD M30. It signals that the trend has been changed from upwards to downwards. Probably, if the base of the pattern 0.8848
Open chart in a new window


