

वास्तविक पैटर्न

पैटर्न ग्राफिकल मॉडल हैं जो चार्ट में मूल्य से बने होते हैं। तकनीकी विश्लेषण भविष्यवाणियों में से एक के अनुसार, इतिहास का मतलब मूल्य आंदोलन खुद को दोहराता है। इसका मतलब है कि मूल्य आंदोलन अक्सर एक ही परिस्थितियों में समान होते हैं जो उच्च संभावना के साथ स्थिति के आगे के विकास की भविष्यवाणी करना संभव बनाता है।
इंस्टा फॉरेक्स द्वारा प्रासंगिक पैटर्न एक उपयोग में आसान सेवा है जो आपको बाजार में नवीनतम परिवर्तनों के बारे में जागरूक होने और समय पर बाजार से संकेतों पर प्रतिक्रिया करने की अनुमति देती है। हमारी सेवा में आप हमेशा किसी भी जोड़ी और किसी भी समय सीमा पर नवीनतम और सबसे प्रासंगिक पैटर्न प्राप्त कर सकते हैं.
Double Bottom
was formed on 15.04 at 15:59:49 (UTC+0)
signal strength 4 of 5
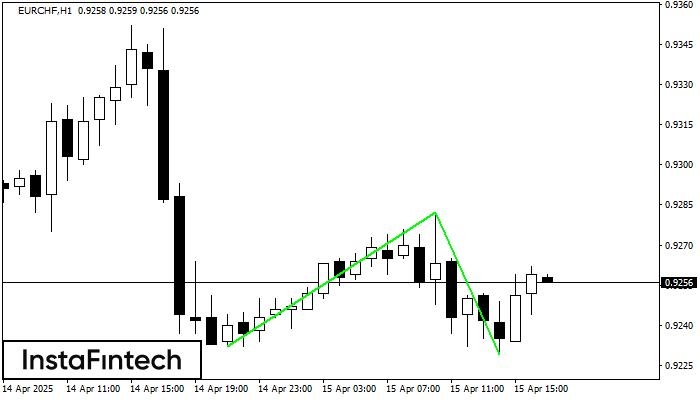
The Double Bottom pattern has been formed on EURCHF H1. Characteristics: the support level 0.9232; the resistance level 0.9282; the width of the pattern 50 points. If the resistance level is broken, a change in the trend can be predicted with the first target point lying at the distance of 53 points.
See Also
- All
- All
- Bearish Rectangle
- Bearish Symmetrical Triangle
- Bearish Symmetrical Triangle
- Bullish Rectangle
- Double Top
- Double Top
- Triple Bottom
- Triple Bottom
- Triple Top
- Triple Top
- All
- All
- Buy
- Sale
- All
- 1
- 2
- 3
- 4
- 5
Persegi Bearish
was formed on 04.05 at 00:51:55 (UTC+0)
signal strength 3 of 5

Menurut grafik dari M30, #Bitcoin terbentuk Persegi Bearish. Jenis pola ini menunjukkan kelanjutan tren. Terdiri dari dua tingkat: resistance 96456.78 - 0.00 dan support 95805.26 – 95805.26. Jika level resistance
Open chart in a new window
Bawah Ganda
was formed on 03.05 at 10:45:44 (UTC+0)
signal strength 2 of 5

Pola Bawah Ganda telah terbentuk pada #Bitcoin M15. Formasi ini mensinyalkan reversal tren dari arah penurunan ke arah kenaikan. Sinyal menunjukkan bahwa transaksi beli harus dibuka setelah batas atas pola
Rangka waktu M5 dan M15 mungkin memiliki lebih dari titik entri yang keliru.
Open chart in a new window
Bawah Ganda
was formed on 03.05 at 08:00:01 (UTC+0)
signal strength 3 of 5

Pola Bawah Ganda telah terbentuk pada #Bitcoin M30; batas atas di 97860.25; batas bawah di 96258.44. Lebar pola sebesar 156618 poin. Jika harga menembus batas atas 97860.25, Perubahan dalam tren
Open chart in a new window


