

वास्तविक पैटर्न

पैटर्न ग्राफिकल मॉडल हैं जो चार्ट में मूल्य से बने होते हैं। तकनीकी विश्लेषण भविष्यवाणियों में से एक के अनुसार, इतिहास का मतलब मूल्य आंदोलन खुद को दोहराता है। इसका मतलब है कि मूल्य आंदोलन अक्सर एक ही परिस्थितियों में समान होते हैं जो उच्च संभावना के साथ स्थिति के आगे के विकास की भविष्यवाणी करना संभव बनाता है।
इंस्टा फॉरेक्स द्वारा प्रासंगिक पैटर्न एक उपयोग में आसान सेवा है जो आपको बाजार में नवीनतम परिवर्तनों के बारे में जागरूक होने और समय पर बाजार से संकेतों पर प्रतिक्रिया करने की अनुमति देती है। हमारी सेवा में आप हमेशा किसी भी जोड़ी और किसी भी समय सीमा पर नवीनतम और सबसे प्रासंगिक पैटर्न प्राप्त कर सकते हैं.
Inverse Head and Shoulder
was formed on 14.04 at 23:05:42 (UTC+0)
signal strength 1 of 5
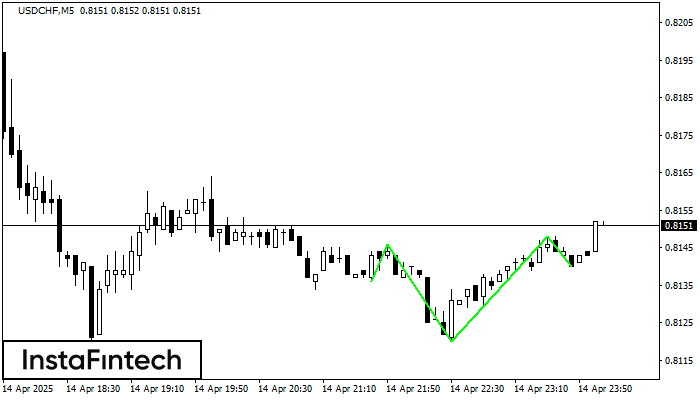
According to the chart of M5, USDCHF formed the Inverse Head and Shoulder pattern. The Head’s top is set at 0.8148 while the median line of the Neck is found at 0.8120/0.8140. The formation of the Inverse Head and Shoulder pattern evidently signals a reversal of the downward trend. In other words, in case the scenario comes true, the price of USDCHF will go towards 0.8163
The M5 and M15 time frames may have more false entry points.
- All
- All
- Bearish Rectangle
- Bearish Symmetrical Triangle
- Bearish Symmetrical Triangle
- Bullish Rectangle
- Double Top
- Double Top
- Triple Bottom
- Triple Bottom
- Triple Top
- Triple Top
- All
- All
- Buy
- Sale
- All
- 1
- 2
- 3
- 4
- 5
Double Top
was formed on 02.05 at 21:50:15 (UTC+0)
signal strength 1 of 5

The Double Top reversal pattern has been formed on USDJPY M5. Characteristics: the upper boundary 145.09; the lower boundary 144.90; the width of the pattern is 18 points. Sell trades
The M5 and M15 time frames may have more false entry points.
Open chart in a new window
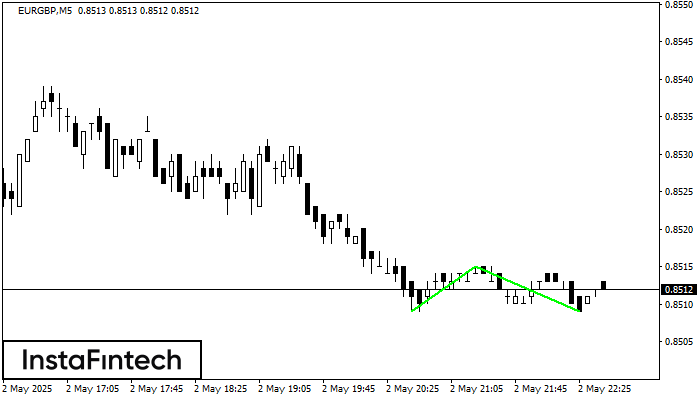
Triple Bottom
was formed on 02.05 at 21:45:21 (UTC+0)
signal strength 1 of 5

The Triple Bottom pattern has been formed on EURGBP M5. It has the following characteristics: resistance level 0.8515/0.8514; support level 0.8509/0.8509; the width is 6 points. In the event
The M5 and M15 time frames may have more false entry points.
Open chart in a new window
Double Bottom
was formed on 02.05 at 21:40:51 (UTC+0)
signal strength 1 of 5
The Double Bottom pattern has been formed on EURGBP M5; the upper boundary is 0.8515; the lower boundary is 0.8509. The width of the pattern is 6 points. In case
The M5 and M15 time frames may have more false entry points.
Open chart in a new window


