

वास्तविक पैटर्न

पैटर्न ग्राफिकल मॉडल हैं जो चार्ट में मूल्य से बने होते हैं। तकनीकी विश्लेषण भविष्यवाणियों में से एक के अनुसार, इतिहास का मतलब मूल्य आंदोलन खुद को दोहराता है। इसका मतलब है कि मूल्य आंदोलन अक्सर एक ही परिस्थितियों में समान होते हैं जो उच्च संभावना के साथ स्थिति के आगे के विकास की भविष्यवाणी करना संभव बनाता है।
इंस्टा फॉरेक्स द्वारा प्रासंगिक पैटर्न एक उपयोग में आसान सेवा है जो आपको बाजार में नवीनतम परिवर्तनों के बारे में जागरूक होने और समय पर बाजार से संकेतों पर प्रतिक्रिया करने की अनुमति देती है। हमारी सेवा में आप हमेशा किसी भी जोड़ी और किसी भी समय सीमा पर नवीनतम और सबसे प्रासंगिक पैटर्न प्राप्त कर सकते हैं.
Bearish Symmetrical Triangle
was formed on 14.04 at 10:31:57 (UTC+0)
signal strength 1 of 5
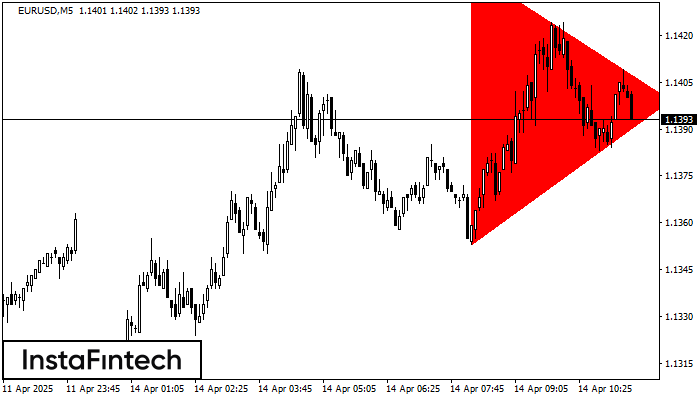
According to the chart of M5, EURUSD formed the Bearish Symmetrical Triangle pattern. Description: The lower border is 1.1353/1.1399 and upper border is 1.1441/1.1399. The pattern width is measured on the chart at -88 pips. The formation of the Bearish Symmetrical Triangle pattern evidently signals a continuation of the downward trend. In other words, if the scenario comes true and EURUSD breaches the lower border, the price could continue its move toward 1.1384.
The M5 and M15 time frames may have more false entry points.
- All
- All
- Bearish Rectangle
- Bearish Symmetrical Triangle
- Bearish Symmetrical Triangle
- Bullish Rectangle
- Double Top
- Double Top
- Triple Bottom
- Triple Bottom
- Triple Top
- Triple Top
- All
- All
- Buy
- Sale
- All
- 1
- 2
- 3
- 4
- 5
বিয়ারিশ সিমেট্রিক্যাল ট্রায়াঙ্গেল
was formed on 02.05 at 09:51:53 (UTC+0)
signal strength 2 of 5
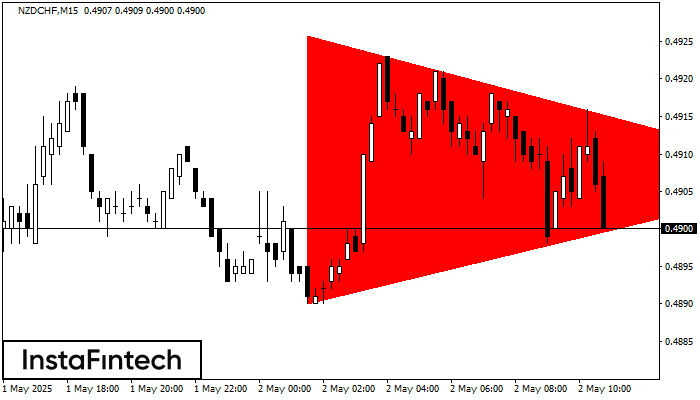
M15 চার্ট অনুযায়ী, NZDCHF বিয়ারিশ সিমেট্রিক্যাল ট্রায়াঙ্গেল প্যাটার্ন গঠন করেছে। বর্ণনা: নীচের সীমানা হচ্ছে 0.4890/0.4907 এবং উপরের সীমানা হল 0.4926/0.4907৷ চার্টে প্যাটার্নের প্রস্থ -36 পিপস বলে পরিমাপ করা হয়েছে। বিয়ারিশ
M5 এবং M15 টাইম ফ্রেমে আরও ভুল এন্ট্রি পয়েন্ট থাকতে পারে।
Open chart in a new window
বুলিশ রেক্ট্যাঙ্গেল
was formed on 02.05 at 09:42:28 (UTC+0)
signal strength 1 of 5
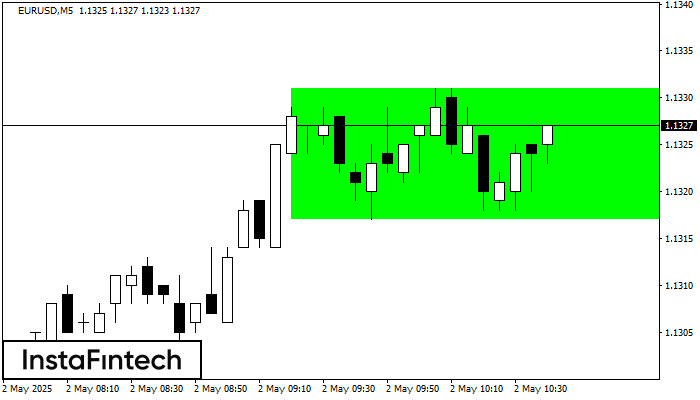
M5 চার্ট অনুযায়ী, EURUSD বুলিশ রেক্ট্যাঙ্গেল গঠন করেছে। এই প্যাটার্ন চলমান প্রবণতার ধারাবাহিকতা নির্দেশ করে। উপরের সীমানা হল 1.1331, নীচের সীমানা হল 1.1317৷ এই সংকেতের অর্থ হল বুলিশ রেক্ট্যাঙ্গেল -এর
M5 এবং M15 টাইম ফ্রেমে আরও ভুল এন্ট্রি পয়েন্ট থাকতে পারে।
Open chart in a new window
ডাবল টপ
was formed on 02.05 at 08:40:32 (UTC+0)
signal strength 1 of 5
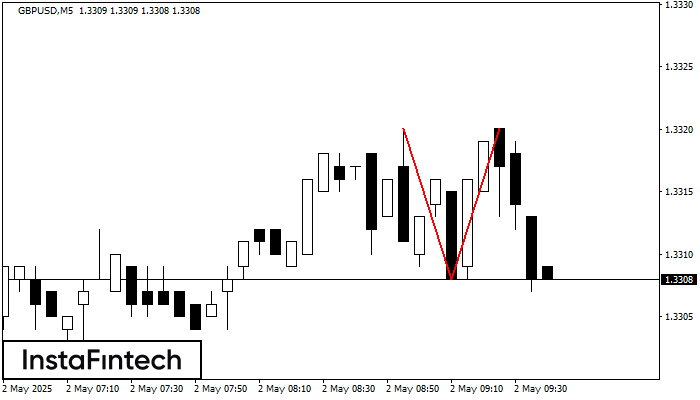
M5 চার্টে, GBPUSD-এর ডাবল টপ রিভার্সাল বা বিপরীতমুখী প্যাটার্ন গঠিত হয়েছে। বৈশিষ্ট্য: উপরের সীমানা 1.3320; নীচের সীমানা 1.3308; প্যাটার্নের প্রস্থ হল 12 পয়েন্ট। 1.3308 1.3293 স্তরের দিকে সম্ভাব্য মুভমেন্টের সাথে
M5 এবং M15 টাইম ফ্রেমে আরও ভুল এন্ট্রি পয়েন্ট থাকতে পারে।
Open chart in a new window


