

वास्तविक पैटर्न

पैटर्न ग्राफिकल मॉडल हैं जो चार्ट में मूल्य से बने होते हैं। तकनीकी विश्लेषण भविष्यवाणियों में से एक के अनुसार, इतिहास का मतलब मूल्य आंदोलन खुद को दोहराता है। इसका मतलब है कि मूल्य आंदोलन अक्सर एक ही परिस्थितियों में समान होते हैं जो उच्च संभावना के साथ स्थिति के आगे के विकास की भविष्यवाणी करना संभव बनाता है।
इंस्टा फॉरेक्स द्वारा प्रासंगिक पैटर्न एक उपयोग में आसान सेवा है जो आपको बाजार में नवीनतम परिवर्तनों के बारे में जागरूक होने और समय पर बाजार से संकेतों पर प्रतिक्रिया करने की अनुमति देती है। हमारी सेवा में आप हमेशा किसी भी जोड़ी और किसी भी समय सीमा पर नवीनतम और सबसे प्रासंगिक पैटर्न प्राप्त कर सकते हैं.
Triple Bottom
was formed on 14.04 at 01:00:54 (UTC+0)
signal strength 4 of 5

The Triple Bottom pattern has been formed on USDCHF H1. It has the following characteristics: resistance level 0.8256/0.8192; support level 0.8140/0.8142; the width is 116 points. In the event of a breakdown of the resistance level of 0.8256, the price is likely to continue an upward movement at least to 0.8138.
See Also
- All
- All
- Bearish Rectangle
- Bearish Symmetrical Triangle
- Bearish Symmetrical Triangle
- Bullish Rectangle
- Double Top
- Double Top
- Triple Bottom
- Triple Bottom
- Triple Top
- Triple Top
- All
- All
- Buy
- Sale
- All
- 1
- 2
- 3
- 4
- 5
Double Top
was formed on 06.05 at 08:00:10 (UTC+0)
signal strength 2 of 5
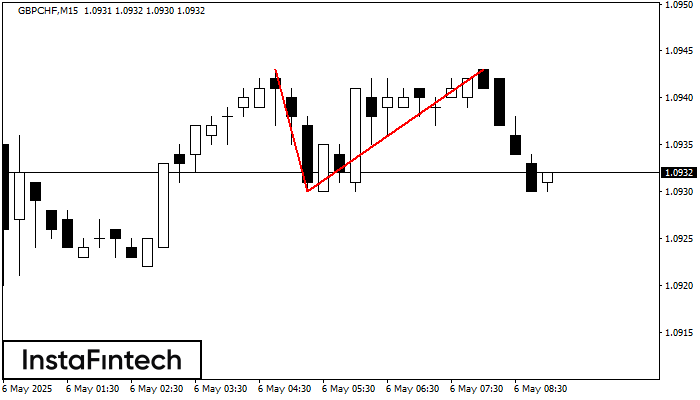
On the chart of GBPCHF M15 the Double Top reversal pattern has been formed. Characteristics: the upper boundary 1.0943; the lower boundary 1.0930; the width of the pattern 13 points
The M5 and M15 time frames may have more false entry points.
Open chart in a new window
Bearish Rectangle
was formed on 06.05 at 07:44:36 (UTC+0)
signal strength 3 of 5
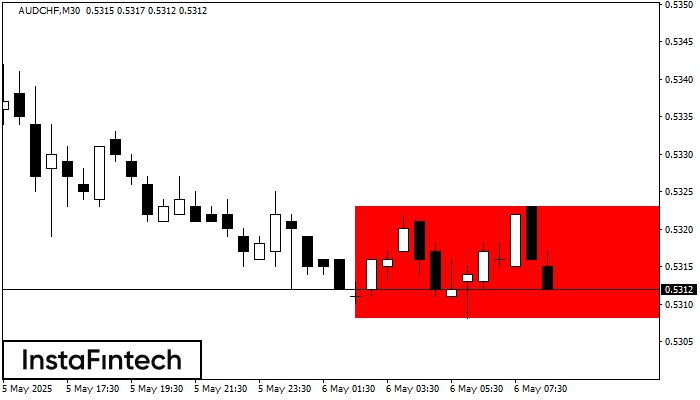
According to the chart of M30, AUDCHF formed the Bearish Rectangle. This type of a pattern indicates a trend continuation. It consists of two levels: resistance 0.5323 - 0.0000
Open chart in a new window
Bearish Symmetrical Triangle
was formed on 06.05 at 07:43:46 (UTC+0)
signal strength 1 of 5
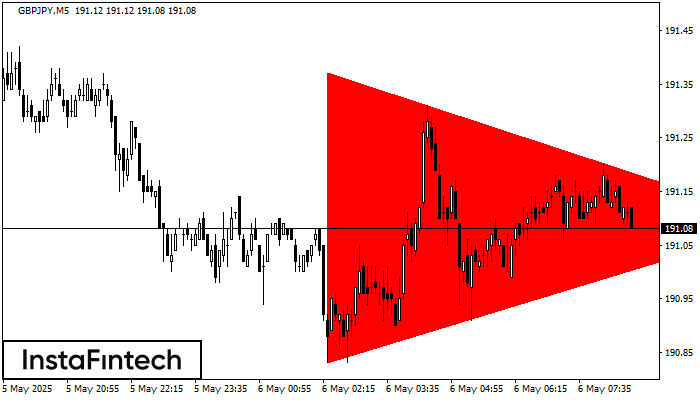
According to the chart of M5, GBPJPY formed the Bearish Symmetrical Triangle pattern. Trading recommendations: A breach of the lower border 190.83 is likely to encourage a continuation
The M5 and M15 time frames may have more false entry points.
Open chart in a new window


