

वास्तविक पैटर्न

पैटर्न ग्राफिकल मॉडल हैं जो चार्ट में मूल्य से बने होते हैं। तकनीकी विश्लेषण भविष्यवाणियों में से एक के अनुसार, इतिहास का मतलब मूल्य आंदोलन खुद को दोहराता है। इसका मतलब है कि मूल्य आंदोलन अक्सर एक ही परिस्थितियों में समान होते हैं जो उच्च संभावना के साथ स्थिति के आगे के विकास की भविष्यवाणी करना संभव बनाता है।
इंस्टा फॉरेक्स द्वारा प्रासंगिक पैटर्न एक उपयोग में आसान सेवा है जो आपको बाजार में नवीनतम परिवर्तनों के बारे में जागरूक होने और समय पर बाजार से संकेतों पर प्रतिक्रिया करने की अनुमति देती है। हमारी सेवा में आप हमेशा किसी भी जोड़ी और किसी भी समय सीमा पर नवीनतम और सबसे प्रासंगिक पैटर्न प्राप्त कर सकते हैं.
Triple Top
was formed on 09.04 at 11:59:50 (UTC+0)
signal strength 1 of 5
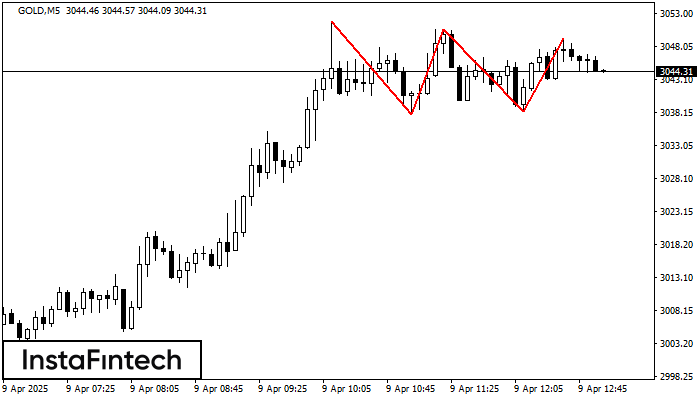
On the chart of the GOLD M5 trading instrument, the Triple Top pattern that signals a trend change has formed. It is possible that after formation of the third peak, the price will try to break through the resistance level 3037.74, where we advise to open a trading position for sale. Take profit is the projection of the pattern’s width, which is 1408 points.
The M5 and M15 time frames may have more false entry points.
- All
- All
- Bearish Rectangle
- Bearish Symmetrical Triangle
- Bearish Symmetrical Triangle
- Bullish Rectangle
- Double Top
- Double Top
- Triple Bottom
- Triple Bottom
- Triple Top
- Triple Top
- All
- All
- Buy
- Sale
- All
- 1
- 2
- 3
- 4
- 5
Bullish Rectangle
was formed on 02.05 at 16:26:31 (UTC+0)
signal strength 1 of 5
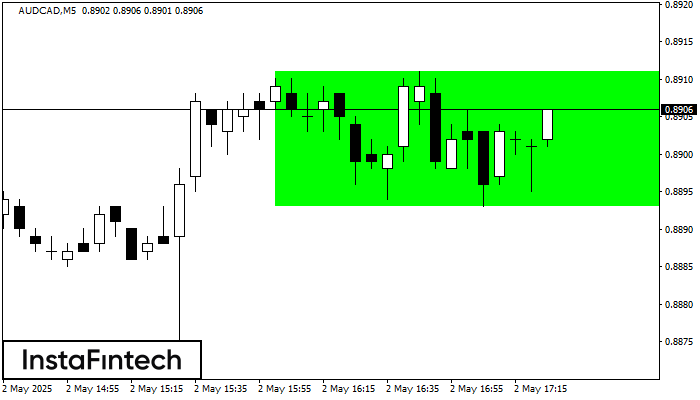
According to the chart of M5, AUDCAD formed the Bullish Rectangle. This type of a pattern indicates a trend continuation. It consists of two levels: resistance 0.8911 and support 0.8893
The M5 and M15 time frames may have more false entry points.
Open chart in a new window
Double Top
was formed on 02.05 at 16:05:28 (UTC+0)
signal strength 1 of 5
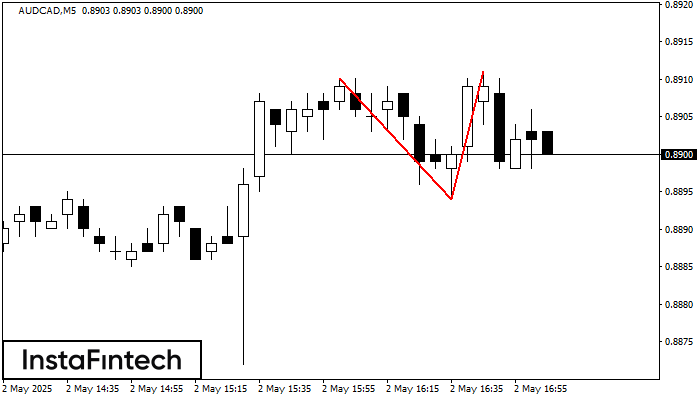
On the chart of AUDCAD M5 the Double Top reversal pattern has been formed. Characteristics: the upper boundary 0.8911; the lower boundary 0.8894; the width of the pattern 17 points
The M5 and M15 time frames may have more false entry points.
Open chart in a new window
Head and Shoulders
was formed on 02.05 at 15:40:20 (UTC+0)
signal strength 1 of 5
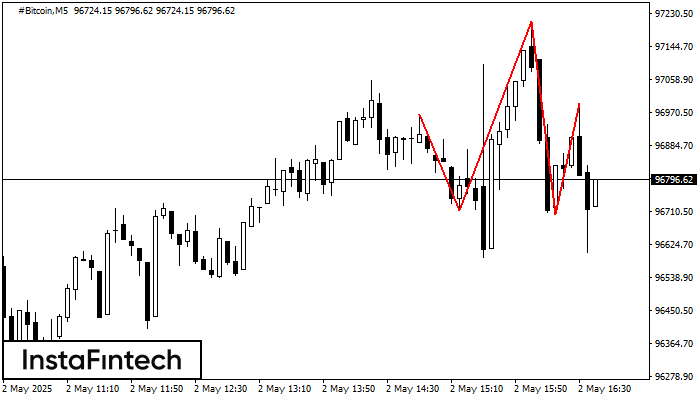
The technical pattern called Head and Shoulders has appeared on the chart of #Bitcoin M5. There are weighty reasons to suggest that the price will surpass the Neckline 96714.23/96704.41 after
The M5 and M15 time frames may have more false entry points.
Open chart in a new window


