

वास्तविक पैटर्न

पैटर्न ग्राफिकल मॉडल हैं जो चार्ट में मूल्य से बने होते हैं। तकनीकी विश्लेषण भविष्यवाणियों में से एक के अनुसार, इतिहास का मतलब मूल्य आंदोलन खुद को दोहराता है। इसका मतलब है कि मूल्य आंदोलन अक्सर एक ही परिस्थितियों में समान होते हैं जो उच्च संभावना के साथ स्थिति के आगे के विकास की भविष्यवाणी करना संभव बनाता है।
इंस्टा फॉरेक्स द्वारा प्रासंगिक पैटर्न एक उपयोग में आसान सेवा है जो आपको बाजार में नवीनतम परिवर्तनों के बारे में जागरूक होने और समय पर बाजार से संकेतों पर प्रतिक्रिया करने की अनुमति देती है। हमारी सेवा में आप हमेशा किसी भी जोड़ी और किसी भी समय सीमा पर नवीनतम और सबसे प्रासंगिक पैटर्न प्राप्त कर सकते हैं.
Triple Bottom
was formed on 08.04 at 07:00:15 (UTC+0)
signal strength 4 of 5
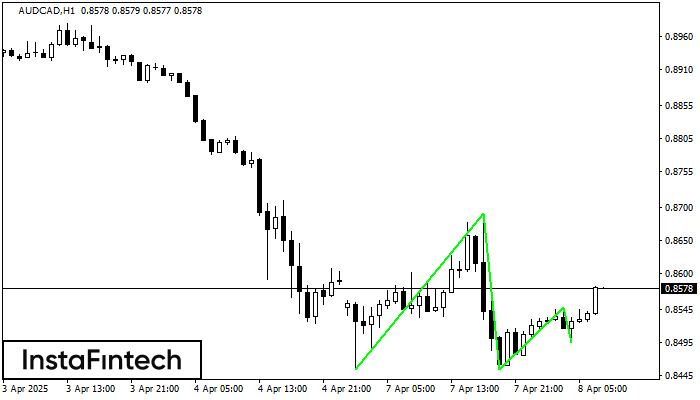
The Triple Bottom pattern has been formed on AUDCAD H1. It has the following characteristics: resistance level 0.8692/0.8549; support level 0.8454/0.8496; the width is 238 points. In the event of a breakdown of the resistance level of 0.8692, the price is likely to continue an upward movement at least to 0.8495.
- All
- All
- Bearish Rectangle
- Bearish Symmetrical Triangle
- Bearish Symmetrical Triangle
- Bullish Rectangle
- Double Top
- Double Top
- Triple Bottom
- Triple Bottom
- Triple Top
- Triple Top
- All
- All
- Buy
- Sale
- All
- 1
- 2
- 3
- 4
- 5
Double Bottom
was formed on 03.05 at 10:45:44 (UTC+0)
signal strength 2 of 5

The Double Bottom pattern has been formed on #Bitcoin M15. This formation signals a reversal of the trend from downwards to upwards. The signal is that a buy trade should
The M5 and M15 time frames may have more false entry points.
Open chart in a new window
Double Bottom
was formed on 03.05 at 08:00:01 (UTC+0)
signal strength 3 of 5

The Double Bottom pattern has been formed on #Bitcoin M30; the upper boundary is 97860.25; the lower boundary is 96258.44. The width of the pattern is 156618 points. In case
Open chart in a new window
Double Bottom
was formed on 03.05 at 06:20:09 (UTC+0)
signal strength 1 of 5

The Double Bottom pattern has been formed on #Bitcoin M5; the upper boundary is 96467.62; the lower boundary is 96258.44. The width of the pattern is 20692 points. In case
The M5 and M15 time frames may have more false entry points.
Open chart in a new window


