

वास्तविक पैटर्न

पैटर्न ग्राफिकल मॉडल हैं जो चार्ट में मूल्य से बने होते हैं। तकनीकी विश्लेषण भविष्यवाणियों में से एक के अनुसार, इतिहास का मतलब मूल्य आंदोलन खुद को दोहराता है। इसका मतलब है कि मूल्य आंदोलन अक्सर एक ही परिस्थितियों में समान होते हैं जो उच्च संभावना के साथ स्थिति के आगे के विकास की भविष्यवाणी करना संभव बनाता है।
इंस्टा फॉरेक्स द्वारा प्रासंगिक पैटर्न एक उपयोग में आसान सेवा है जो आपको बाजार में नवीनतम परिवर्तनों के बारे में जागरूक होने और समय पर बाजार से संकेतों पर प्रतिक्रिया करने की अनुमति देती है। हमारी सेवा में आप हमेशा किसी भी जोड़ी और किसी भी समय सीमा पर नवीनतम और सबसे प्रासंगिक पैटर्न प्राप्त कर सकते हैं.
Triple Bottom
was formed on 04.04 at 08:30:30 (UTC+0)
signal strength 3 of 5
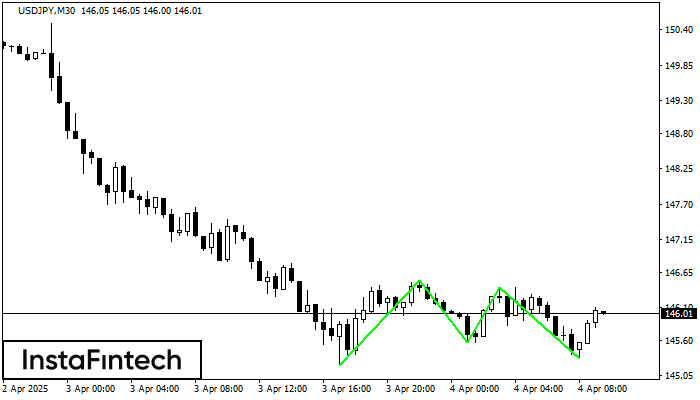
The Triple Bottom pattern has formed on the chart of the USDJPY M30 trading instrument. The pattern signals a change in the trend from downwards to upwards in the case of breakdown of 146.52/146.42.
See Also
- All
- All
- Bearish Rectangle
- Bearish Symmetrical Triangle
- Bearish Symmetrical Triangle
- Bullish Rectangle
- Double Top
- Double Top
- Triple Bottom
- Triple Bottom
- Triple Top
- Triple Top
- All
- All
- Buy
- Sale
- All
- 1
- 2
- 3
- 4
- 5
Segitiga Simetris Bullish
was formed on 15.04 at 22:01:32 (UTC+0)
signal strength 3 of 5
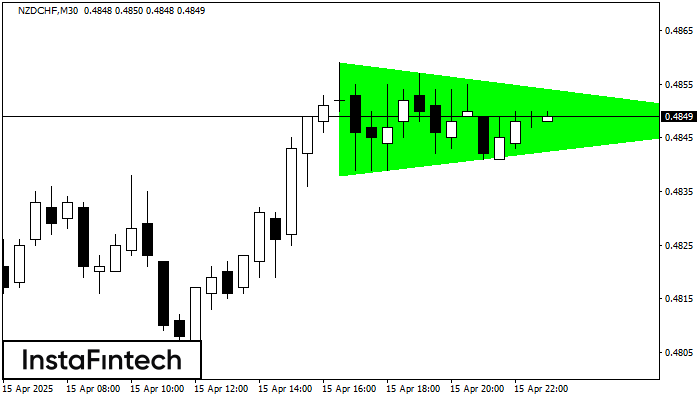
Menurut Grafik dari M30, NZDCHF dibentuk pola Segitiga Simetris Bullish. Batas yang lebih rendah dari pola menyentuh kordinat 0.4838/0.4848 dimana batas atas berada sepanjang 0.4859/0.4848. Jika pola Segitiga Simetris Bullish
Open chart in a new window
Persegi Bullish
was formed on 15.04 at 22:01:27 (UTC+0)
signal strength 3 of 5

Menurut grafik dari M30, NZDCHF terbentuk Persegi Bullish. Jenis pola ini menunjukkan kelanjutan tren. Terdiri dari dua tingkat: resistance 0.4859 dan support 0.4839. Jika level resistance 0.4859 - 0.4859 ditembus
Open chart in a new window
Teratas Ganda
was formed on 15.04 at 21:47:34 (UTC+0)
signal strength 2 of 5
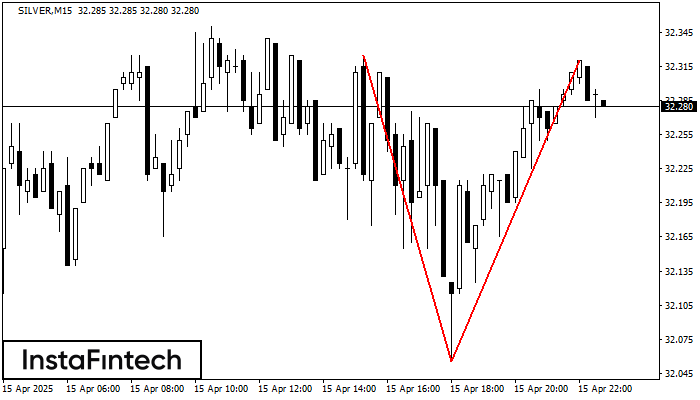
Pola reversal Teratas Ganda telah terbentuk pada SILVER M15. Karakteristik: batas atas 32.33; batas bawah 32.05; lebar pola 265 poin. Transaksi jual lebih baik dibuka di bawah batas bawah 32.05
Rangka waktu M5 dan M15 mungkin memiliki lebih dari titik entri yang keliru.
Open chart in a new window


