

वास्तविक पैटर्न

पैटर्न ग्राफिकल मॉडल हैं जो चार्ट में मूल्य से बने होते हैं। तकनीकी विश्लेषण भविष्यवाणियों में से एक के अनुसार, इतिहास का मतलब मूल्य आंदोलन खुद को दोहराता है। इसका मतलब है कि मूल्य आंदोलन अक्सर एक ही परिस्थितियों में समान होते हैं जो उच्च संभावना के साथ स्थिति के आगे के विकास की भविष्यवाणी करना संभव बनाता है।
इंस्टा फॉरेक्स द्वारा प्रासंगिक पैटर्न एक उपयोग में आसान सेवा है जो आपको बाजार में नवीनतम परिवर्तनों के बारे में जागरूक होने और समय पर बाजार से संकेतों पर प्रतिक्रिया करने की अनुमति देती है। हमारी सेवा में आप हमेशा किसी भी जोड़ी और किसी भी समय सीमा पर नवीनतम और सबसे प्रासंगिक पैटर्न प्राप्त कर सकते हैं.
Head and Shoulders
was formed on 02.04 at 09:15:29 (UTC+0)
signal strength 1 of 5

The NZDJPY M5 formed the Head and Shoulders pattern with the following features: The Head’s top is at 85.95, the Neckline and the upward angle are at 85.69/85.68. The formation of this pattern can bring about changes in the current trend from bullish to bearish. In case the pattern triggers the expected changes, the price of NZDJPY will go towards 85.53.
The M5 and M15 time frames may have more false entry points.
See Also
- All
- All
- Bearish Rectangle
- Bearish Symmetrical Triangle
- Bearish Symmetrical Triangle
- Bullish Rectangle
- Double Top
- Double Top
- Triple Bottom
- Triple Bottom
- Triple Top
- Triple Top
- All
- All
- Buy
- Sale
- All
- 1
- 2
- 3
- 4
- 5
Teratas Ganda
was formed on 06.05 at 15:15:53 (UTC+0)
signal strength 2 of 5
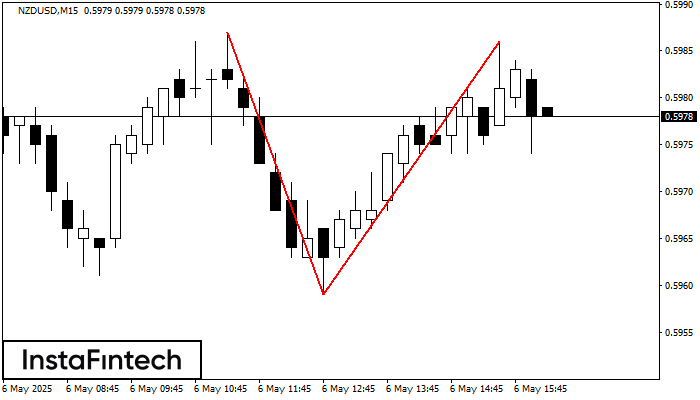
Pola reversal Teratas Ganda telah terbentuk pada NZDUSD M15. Karakteristik: batas atas 0.5987; batas bawah 0.5959; lebar pola 27 poin. Transaksi jual lebih baik dibuka di bawah batas bawah 0.5959
Rangka waktu M5 dan M15 mungkin memiliki lebih dari titik entri yang keliru.
Open chart in a new window
Teratas Triple
was formed on 06.05 at 14:45:37 (UTC+0)
signal strength 2 of 5
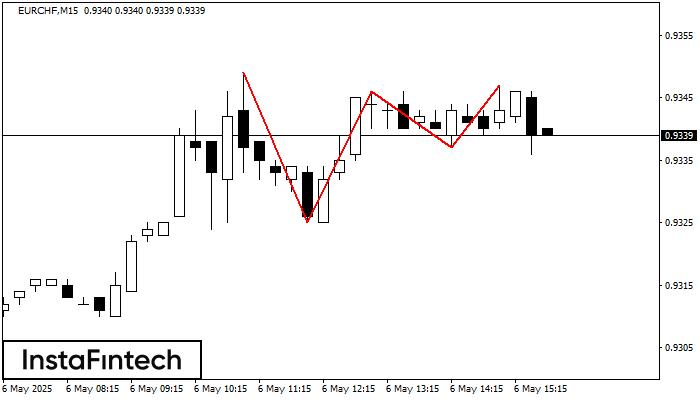
Pola Teratas Triple telah terbentuk pada grafik instrumen trading EURCHF M15. Pola tersebut merupakan pola reversal menampilkan karakteristik berikut: level resistance 2, levek support -12, dan lebar pola 24. Prakiraan
Rangka waktu M5 dan M15 mungkin memiliki lebih dari titik entri yang keliru.
Open chart in a new window
Persegi Bullish
was formed on 06.05 at 14:32:12 (UTC+0)
signal strength 2 of 5
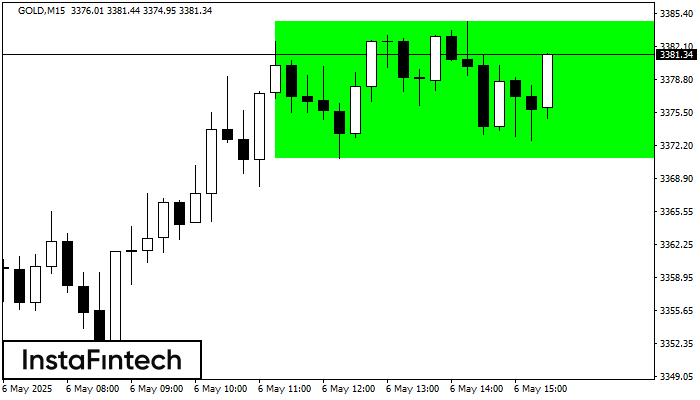
Menurut grafik dari M15, GOLD terbentuk Persegi Bullish yang merupakan pola dari kelanjutan tren. Pola terkandung dalam batas berikut: batas yang lebih rendah 3370.94 – 3370.94 dan batas atas 3384.62
Rangka waktu M5 dan M15 mungkin memiliki lebih dari titik entri yang keliru.
Open chart in a new window


