

वास्तविक पैटर्न

पैटर्न ग्राफिकल मॉडल हैं जो चार्ट में मूल्य से बने होते हैं। तकनीकी विश्लेषण भविष्यवाणियों में से एक के अनुसार, इतिहास का मतलब मूल्य आंदोलन खुद को दोहराता है। इसका मतलब है कि मूल्य आंदोलन अक्सर एक ही परिस्थितियों में समान होते हैं जो उच्च संभावना के साथ स्थिति के आगे के विकास की भविष्यवाणी करना संभव बनाता है।
इंस्टा फॉरेक्स द्वारा प्रासंगिक पैटर्न एक उपयोग में आसान सेवा है जो आपको बाजार में नवीनतम परिवर्तनों के बारे में जागरूक होने और समय पर बाजार से संकेतों पर प्रतिक्रिया करने की अनुमति देती है। हमारी सेवा में आप हमेशा किसी भी जोड़ी और किसी भी समय सीमा पर नवीनतम और सबसे प्रासंगिक पैटर्न प्राप्त कर सकते हैं.
Bullish Symmetrical Triangle
was formed on 01.04 at 13:20:50 (UTC+0)
signal strength 2 of 5
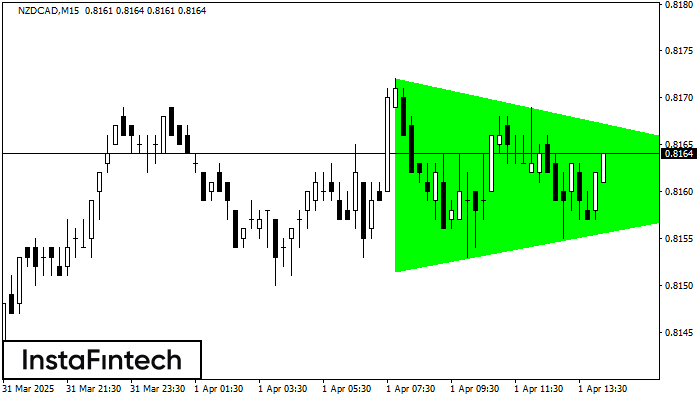
According to the chart of M15, NZDCAD formed the Bullish Symmetrical Triangle pattern. Description: This is the pattern of a trend continuation. 0.8172 and 0.8152 are the coordinates of the upper and lower borders respectively. The pattern width is measured on the chart at 20 pips. Outlook: If the upper border 0.8172 is broken, the price is likely to continue its move by 0.8184.
The M5 and M15 time frames may have more false entry points.
See Also
- All
- All
- Bearish Rectangle
- Bearish Symmetrical Triangle
- Bearish Symmetrical Triangle
- Bullish Rectangle
- Double Top
- Double Top
- Triple Bottom
- Triple Bottom
- Triple Top
- Triple Top
- All
- All
- Buy
- Sale
- All
- 1
- 2
- 3
- 4
- 5
Triple Bottom
сформирован 05.05 в 10:00:09 (UTC+0)
сила сигнала 3 из 5
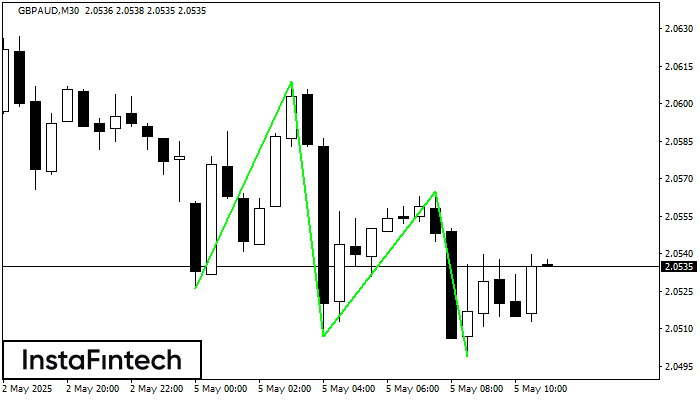
The Triple Bottom pattern has formed on the chart of GBPAUD M30. Features of the pattern: The lower line of the pattern has coordinates 2.0609 with the upper limit 2.0609/2.0565
Открыть график инструмента в новом окне
Double Top
сформирован 05.05 в 09:45:08 (UTC+0)
сила сигнала 1 из 5
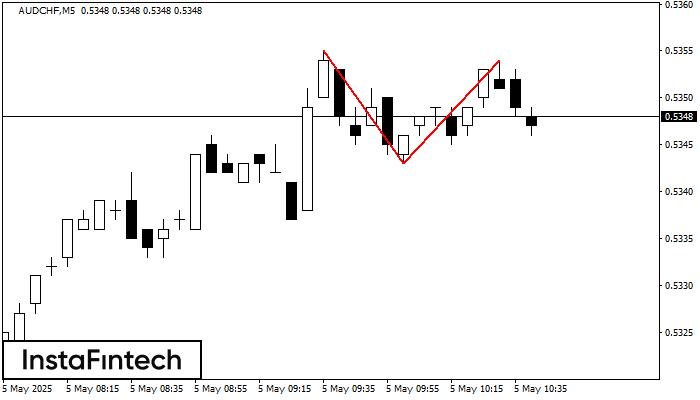
The Double Top reversal pattern has been formed on AUDCHF M5. Characteristics: the upper boundary 0.5355; the lower boundary 0.5343; the width of the pattern is 11 points. Sell trades
The M5 and M15 time frames may have more false entry points.
Открыть график инструмента в новом окне
Bullish Rectangle
сформирован 05.05 в 09:26:05 (UTC+0)
сила сигнала 1 из 5
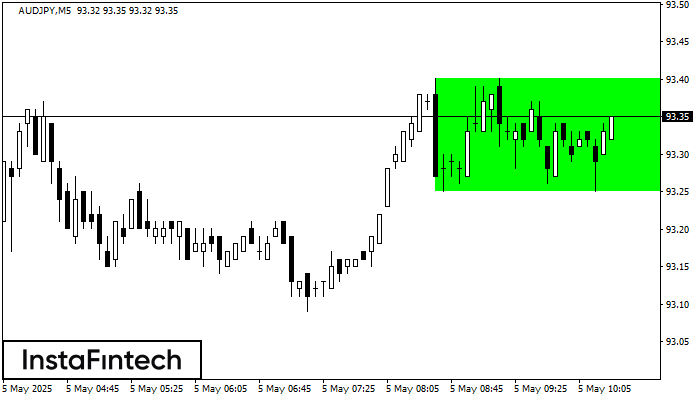
According to the chart of M5, AUDJPY formed the Bullish Rectangle. The pattern indicates a trend continuation. The upper border is 93.40, the lower border is 93.25. The signal means
The M5 and M15 time frames may have more false entry points.
Открыть график инструмента в новом окне


