

वास्तविक पैटर्न

पैटर्न ग्राफिकल मॉडल हैं जो चार्ट में मूल्य से बने होते हैं। तकनीकी विश्लेषण भविष्यवाणियों में से एक के अनुसार, इतिहास का मतलब मूल्य आंदोलन खुद को दोहराता है। इसका मतलब है कि मूल्य आंदोलन अक्सर एक ही परिस्थितियों में समान होते हैं जो उच्च संभावना के साथ स्थिति के आगे के विकास की भविष्यवाणी करना संभव बनाता है।
इंस्टा फॉरेक्स द्वारा प्रासंगिक पैटर्न एक उपयोग में आसान सेवा है जो आपको बाजार में नवीनतम परिवर्तनों के बारे में जागरूक होने और समय पर बाजार से संकेतों पर प्रतिक्रिया करने की अनुमति देती है। हमारी सेवा में आप हमेशा किसी भी जोड़ी और किसी भी समय सीमा पर नवीनतम और सबसे प्रासंगिक पैटर्न प्राप्त कर सकते हैं.
Bearish pennant
was formed on 31.03 at 18:00:41 (UTC+0)
signal strength 3 of 5

The Bearish pennant pattern has formed on the #NTDOY M30 chart. It signals potential continuation of the existing trend. Specifications: the pattern’s bottom has the coordinate of 16.77; the projection of the flagpole height is equal to 126 pips. In case the price breaks out the pattern’s bottom of 16.77, the downtrend is expected to continue for further level 16.47.
See Also
- All
- All
- Bearish Rectangle
- Bearish Symmetrical Triangle
- Bearish Symmetrical Triangle
- Bullish Rectangle
- Double Top
- Double Top
- Triple Bottom
- Triple Bottom
- Triple Top
- Triple Top
- All
- All
- Buy
- Sale
- All
- 1
- 2
- 3
- 4
- 5
ডাবল বটম
was formed on 05.05 at 12:20:14 (UTC+0)
signal strength 1 of 5
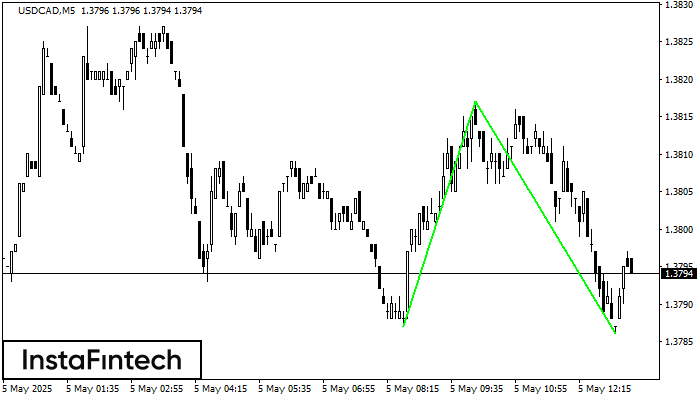
M5 চার্টে, USDCAD-এর ডাবল বটম প্যাটার্নটি গঠিত হয়েছে। উপরের সীমানা হল 1.3817; নীচের সীমানা হল 1.3786। প্যাটার্নের প্রস্থ হল 30 পয়েন্ট। 1.3817-এর উপরের সীমানা ভেদ করার ক্ষেত্রে, প্রবণতা পরিবর্তনের পূর্বাভাস
M5 এবং M15 টাইম ফ্রেমে আরও ভুল এন্ট্রি পয়েন্ট থাকতে পারে।
Open chart in a new window
ডাবল টপ
was formed on 05.05 at 12:19:52 (UTC+0)
signal strength 1 of 5
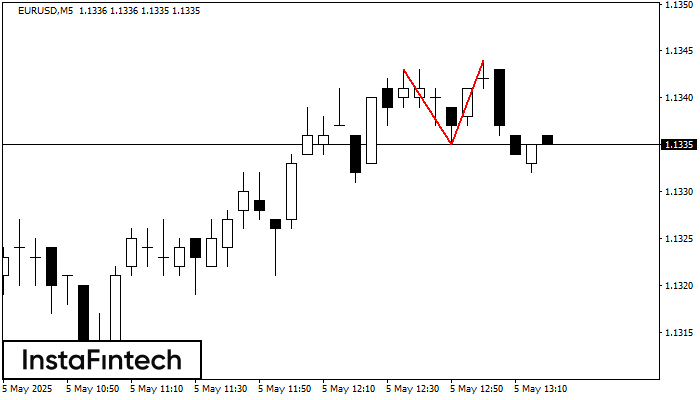
M5 চার্টে, EURUSD-এর ডাবল টপ রিভার্সাল বা বিপরীতমুখী প্যাটার্ন গঠিত হয়েছে। বৈশিষ্ট্য: উপরের সীমানা 1.1344; নীচের সীমানা 1.1335; প্যাটার্নের প্রস্থ 9 পয়েন্ট। সংকেত: নীচের সীমানা ব্রেক করা হলে 1.1320 স্তরের
M5 এবং M15 টাইম ফ্রেমে আরও ভুল এন্ট্রি পয়েন্ট থাকতে পারে।
Open chart in a new window
বিয়ারিশ সিমেট্রিক্যাল ট্রায়াঙ্গেল
was formed on 05.05 at 11:17:27 (UTC+0)
signal strength 3 of 5
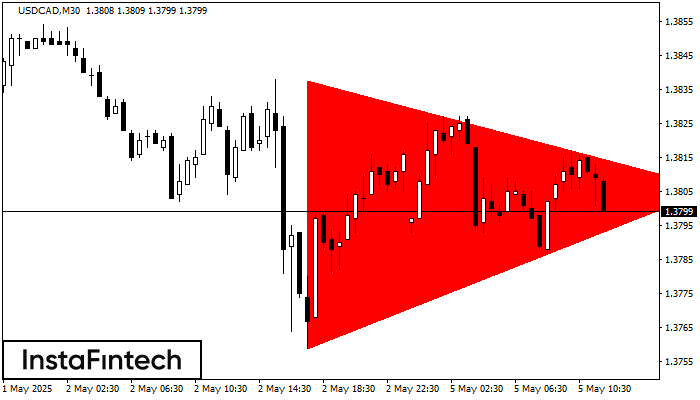
M30 এর চার্ট অনুযায়ী, USDCAD বিয়ারিশ সিমেট্রিক্যাল ট্রায়াঙ্গেল প্যাটার্ন গঠন করেছে। ট্রেডিংয়ের পরামর্শ: 1.3759 এর নীচের সীমানা লঙ্ঘন করা হলে নিম্নমুখী প্রবণতা অব্যাহত রাখতে উৎসাহিত করবে।
Open chart in a new window


