

वास्तविक पैटर्न

पैटर्न ग्राफिकल मॉडल हैं जो चार्ट में मूल्य से बने होते हैं। तकनीकी विश्लेषण भविष्यवाणियों में से एक के अनुसार, इतिहास का मतलब मूल्य आंदोलन खुद को दोहराता है। इसका मतलब है कि मूल्य आंदोलन अक्सर एक ही परिस्थितियों में समान होते हैं जो उच्च संभावना के साथ स्थिति के आगे के विकास की भविष्यवाणी करना संभव बनाता है।
इंस्टा फॉरेक्स द्वारा प्रासंगिक पैटर्न एक उपयोग में आसान सेवा है जो आपको बाजार में नवीनतम परिवर्तनों के बारे में जागरूक होने और समय पर बाजार से संकेतों पर प्रतिक्रिया करने की अनुमति देती है। हमारी सेवा में आप हमेशा किसी भी जोड़ी और किसी भी समय सीमा पर नवीनतम और सबसे प्रासंगिक पैटर्न प्राप्त कर सकते हैं.
Double Top
was formed on 31.03 at 04:40:34 (UTC+0)
signal strength 1 of 5
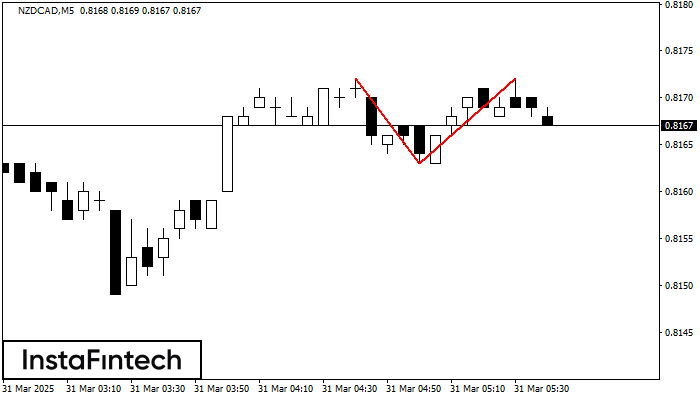
On the chart of NZDCAD M5 the Double Top reversal pattern has been formed. Characteristics: the upper boundary 0.8172; the lower boundary 0.8163; the width of the pattern 9 points. The signal: a break of the lower boundary will cause continuation of the downward trend targeting the 0.8148 level.
The M5 and M15 time frames may have more false entry points.
See Also
- All
- All
- Bearish Rectangle
- Bearish Symmetrical Triangle
- Bearish Symmetrical Triangle
- Bullish Rectangle
- Double Top
- Double Top
- Triple Bottom
- Triple Bottom
- Triple Top
- Triple Top
- All
- All
- Buy
- Sale
- All
- 1
- 2
- 3
- 4
- 5
বুলিশ পেন্যান্ট
was formed on 13.04 at 11:56:52 (UTC+0)
signal strength 1 of 5

বুলিশ পেন্যান্ট সংকেত – M5 -এ #Bitcoin ট্রেডিং ইন্সট্রুমেন্টের ধারাবাহিকতার প্যাটার্ন। পূর্বাভাস: প্যাটার্নের সর্বোচ্চ 84963.00 এর উপরে বাই পজিশন নির্ধারণ করা সম্ভব, পরবর্তী পদক্ষেপে ফ্ল্যাগপোলের উচ্চতার একটি প্রজেকশনের সম্ভাবনা রয়েছে।
M5 এবং M15 টাইম ফ্রেমে আরও ভুল এন্ট্রি পয়েন্ট থাকতে পারে।
Open chart in a new window
বুলিশ রেক্ট্যাঙ্গেল
was formed on 11.04 at 22:20:31 (UTC+0)
signal strength 1 of 5

M5 চার্ট অনুযায়ী, NZDCHF বুলিশ রেক্ট্যাঙ্গেল গঠন করেছে। এই প্যাটার্ন চলমান প্রবণতার ধারাবাহিকতা নির্দেশ করে। উপরের সীমানা হল 0.4754, নীচের সীমানা হল 0.4746৷ এই সংকেতের অর্থ হল বুলিশ রেক্ট্যাঙ্গেল -এর
M5 এবং M15 টাইম ফ্রেমে আরও ভুল এন্ট্রি পয়েন্ট থাকতে পারে।
Open chart in a new window
বিয়ারিশ রেক্ট্যাঙ্গেল
was formed on 11.04 at 22:10:27 (UTC+0)
signal strength 1 of 5

M5 চার্ট অনুসারে, USDCAD বিয়ারিশ রেক্ট্যাঙ্গেল গঠন করেছে যা চলমান প্রবণতার ধারাবাহিকতার প্যাটার্ন। প্যাটার্নটি নিম্নলিখিত সীমানার মধ্যে রয়েছে: নীচের সীমানা 1.3871 – 1.3871 এবং উপরের সীমানা 1.3891 – 1.3891৷ নীচের
M5 এবং M15 টাইম ফ্রেমে আরও ভুল এন্ট্রি পয়েন্ট থাকতে পারে।
Open chart in a new window


