

वास्तविक पैटर्न

पैटर्न ग्राफिकल मॉडल हैं जो चार्ट में मूल्य से बने होते हैं। तकनीकी विश्लेषण भविष्यवाणियों में से एक के अनुसार, इतिहास का मतलब मूल्य आंदोलन खुद को दोहराता है। इसका मतलब है कि मूल्य आंदोलन अक्सर एक ही परिस्थितियों में समान होते हैं जो उच्च संभावना के साथ स्थिति के आगे के विकास की भविष्यवाणी करना संभव बनाता है।
इंस्टा फॉरेक्स द्वारा प्रासंगिक पैटर्न एक उपयोग में आसान सेवा है जो आपको बाजार में नवीनतम परिवर्तनों के बारे में जागरूक होने और समय पर बाजार से संकेतों पर प्रतिक्रिया करने की अनुमति देती है। हमारी सेवा में आप हमेशा किसी भी जोड़ी और किसी भी समय सीमा पर नवीनतम और सबसे प्रासंगिक पैटर्न प्राप्त कर सकते हैं.
Double Bottom
was formed on 30.03 at 23:00:32 (UTC+0)
signal strength 2 of 5
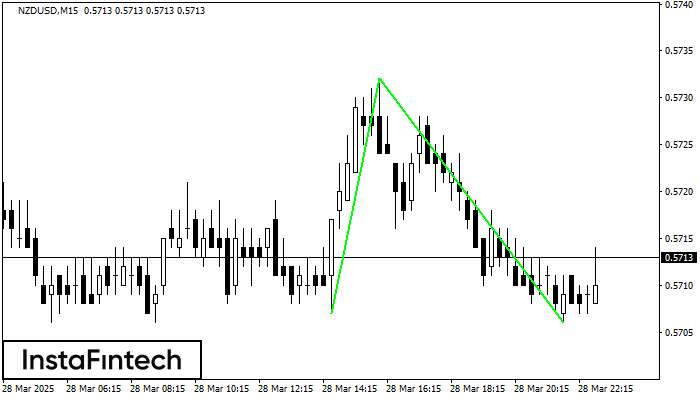
The Double Bottom pattern has been formed on NZDUSD M15; the upper boundary is 0.5732; the lower boundary is 0.5706. The width of the pattern is 25 points. In case of a break of the upper boundary 0.5732, a change in the trend can be predicted where the width of the pattern will coincide with the distance to a possible take profit level.
The M5 and M15 time frames may have more false entry points.
See Also
- All
- All
- Bearish Rectangle
- Bearish Symmetrical Triangle
- Bearish Symmetrical Triangle
- Bullish Rectangle
- Double Top
- Double Top
- Triple Bottom
- Triple Bottom
- Triple Top
- Triple Top
- All
- All
- Buy
- Sale
- All
- 1
- 2
- 3
- 4
- 5
बियरिश सिमेट्रिकल त्रिभुज
was formed on 07.05 at 02:30:44 (UTC+0)
signal strength 2 of 5
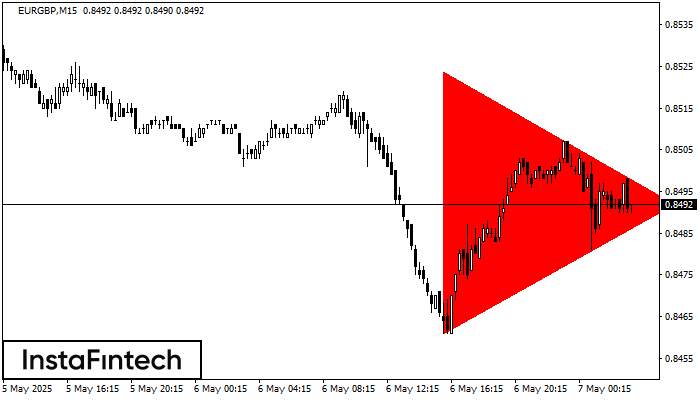
M15 के चार्ट के अनुसार, EURGBP से बियरिश सिमेट्रिकल त्रिभुज पैटर्न बना। ट्रेडिंग अनुशंसाएं: संभावना है की निचली सीमा 0.8461 का उल्लंघन नीचे की प्रवृत्ति को जारी रखने के लिए
M5 और M15 समय सीमा में अधिक फाल्स एंट्री पॉइंट्स हो सकते हैं।
Open chart in a new window
डबल बॉटम
was formed on 07.05 at 01:00:48 (UTC+0)
signal strength 4 of 5
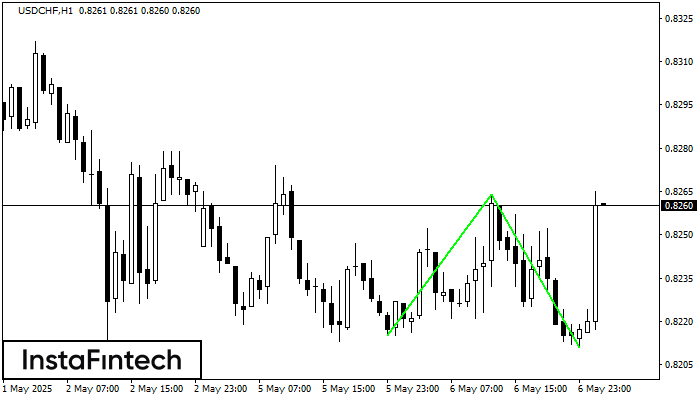
डबल बॉटम पैटर्न USDCHF H1 पर बना है; ऊपरी सीमा 0.8264 है; निचली सीमा 0.8211 है। पैटर्न की चौड़ाई 49 अंक है। ऊपरी सीमा 0.8264 के टूटने के मामले में
Open chart in a new window
डबल बॉटम
was formed on 07.05 at 01:00:39 (UTC+0)
signal strength 4 of 5
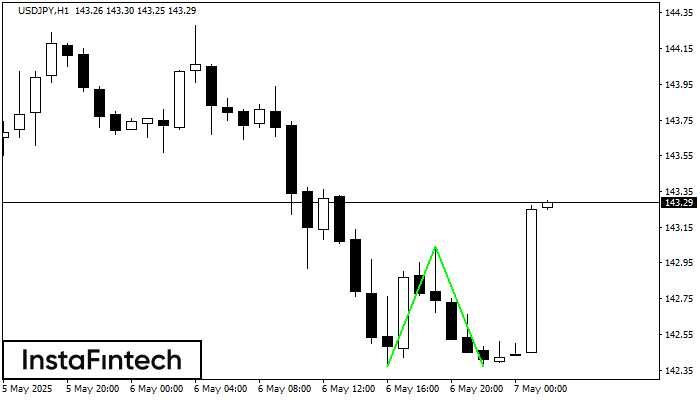
डबल बॉटम पैटर्न USDJPY H1 पर बना है। विशेषताएं: समर्थन स्तर 142.37; प्रतिरोध स्तर 143.04; पैटर्न की चौड़ाई 67 पॉइंट्स। यदि प्रतिरोध स्तर टूट जाता है, तो रुझान में बदलाव
Open chart in a new window


