

वास्तविक पैटर्न

पैटर्न ग्राफिकल मॉडल हैं जो चार्ट में मूल्य से बने होते हैं। तकनीकी विश्लेषण भविष्यवाणियों में से एक के अनुसार, इतिहास का मतलब मूल्य आंदोलन खुद को दोहराता है। इसका मतलब है कि मूल्य आंदोलन अक्सर एक ही परिस्थितियों में समान होते हैं जो उच्च संभावना के साथ स्थिति के आगे के विकास की भविष्यवाणी करना संभव बनाता है।
इंस्टा फॉरेक्स द्वारा प्रासंगिक पैटर्न एक उपयोग में आसान सेवा है जो आपको बाजार में नवीनतम परिवर्तनों के बारे में जागरूक होने और समय पर बाजार से संकेतों पर प्रतिक्रिया करने की अनुमति देती है। हमारी सेवा में आप हमेशा किसी भी जोड़ी और किसी भी समय सीमा पर नवीनतम और सबसे प्रासंगिक पैटर्न प्राप्त कर सकते हैं.
Bullish Rectangle
was formed on 26.03 at 14:44:13 (UTC+0)
signal strength 3 of 5
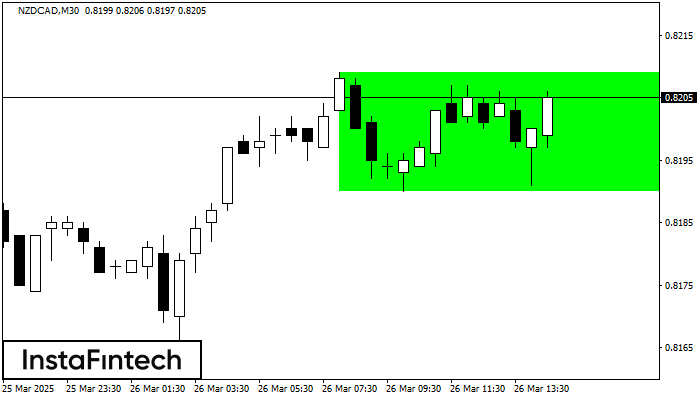
According to the chart of M30, NZDCAD formed the Bullish Rectangle which is a pattern of a trend continuation. The pattern is contained within the following borders: the lower border 0.8190 – 0.8190 and upper border 0.8209 – 0.8209. In case the upper border is broken, the instrument is likely to follow the upward trend.
- All
- All
- Bearish Rectangle
- Bearish Symmetrical Triangle
- Bearish Symmetrical Triangle
- Bullish Rectangle
- Double Top
- Double Top
- Triple Bottom
- Triple Bottom
- Triple Top
- Triple Top
- All
- All
- Buy
- Sale
- All
- 1
- 2
- 3
- 4
- 5
Triple Bottom
was formed on 02.05 at 22:50:22 (UTC+0)
signal strength 1 of 5

Corak Triple Bottom telah dibentuk pada EURGBP M5. Ia mempunyai ciri-ciri berikut: tahap rintangan 0.8515/0.8514; tahap sokongan 0.8509/0.8509; lebar corak adalah 6 mata. Dalam situasi penembusan paras rintangan 0.8515, harga
Carta masa M5 dan M15 mungkin mempunyai lebih banyak titik kemasukan palsu.
Open chart in a new window
Double Top
was formed on 02.05 at 21:50:15 (UTC+0)
signal strength 1 of 5

Corak pembalikan Double Top telah dibentuk pada USDJPY M5. Ciri-ciri: sempadan atas %P0.000000; sempadan bawah 145.09; sempadan bawah 144.90; lebar corak adalah 18 mata. Dagangan menjual adalah lebih baik untuk
Carta masa M5 dan M15 mungkin mempunyai lebih banyak titik kemasukan palsu.
Open chart in a new window
Triple Bottom
was formed on 02.05 at 21:45:21 (UTC+0)
signal strength 1 of 5

Corak Triple Bottom telah dibentuk pada EURGBP M5. Ia mempunyai ciri-ciri berikut: tahap rintangan 0.8515/0.8514; tahap sokongan 0.8509/0.8509; lebar corak adalah 6 mata. Dalam situasi penembusan paras rintangan 0.8515, harga
Carta masa M5 dan M15 mungkin mempunyai lebih banyak titik kemasukan palsu.
Open chart in a new window


