

वास्तविक पैटर्न

पैटर्न ग्राफिकल मॉडल हैं जो चार्ट में मूल्य से बने होते हैं। तकनीकी विश्लेषण भविष्यवाणियों में से एक के अनुसार, इतिहास का मतलब मूल्य आंदोलन खुद को दोहराता है। इसका मतलब है कि मूल्य आंदोलन अक्सर एक ही परिस्थितियों में समान होते हैं जो उच्च संभावना के साथ स्थिति के आगे के विकास की भविष्यवाणी करना संभव बनाता है।
इंस्टा फॉरेक्स द्वारा प्रासंगिक पैटर्न एक उपयोग में आसान सेवा है जो आपको बाजार में नवीनतम परिवर्तनों के बारे में जागरूक होने और समय पर बाजार से संकेतों पर प्रतिक्रिया करने की अनुमति देती है। हमारी सेवा में आप हमेशा किसी भी जोड़ी और किसी भी समय सीमा पर नवीनतम और सबसे प्रासंगिक पैटर्न प्राप्त कर सकते हैं.
Bullish pennant
was formed on 24.03 at 21:00:18 (UTC+0)
signal strength 3 of 5
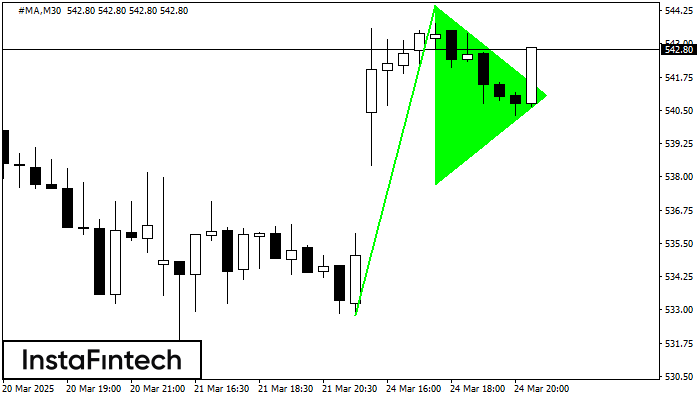
The Bullish pennant pattern is formed on the #MA M30 chart. It is a type of the continuation pattern. Supposedly, in case the price is fixed above the pennant’s high of 544.44, a further uptrend is possible.
See Also
- All
- All
- Bearish Rectangle
- Bearish Symmetrical Triangle
- Bearish Symmetrical Triangle
- Bullish Rectangle
- Double Top
- Double Top
- Triple Bottom
- Triple Bottom
- Triple Top
- Triple Top
- All
- All
- Buy
- Sale
- All
- 1
- 2
- 3
- 4
- 5
ट्रिपल बॉटम
was formed on 02.05 at 22:50:22 (UTC+0)
signal strength 1 of 5

ट्रिपल बॉटम पैटर्न EURGBP M5 पर बना है। इसकी निम्नलिखित विशेषताएं हैं: प्रतिरोध स्तर 0.8515/0.8514; समर्थन स्तर 0.8509/0.8509; चौड़ाई 6 पॉइंट्स है। 0.8515 के प्रतिरोध स्तर के टूटने की स्थिति
M5 और M15 समय सीमा में अधिक फाल्स एंट्री पॉइंट्स हो सकते हैं।
Open chart in a new window
डबल टॉप
was formed on 02.05 at 21:50:15 (UTC+0)
signal strength 1 of 5

USDJPY M5 पर डबल टॉप रीवर्सल पैटर्न बना है। विशेषताएं: ऊपरी सीमा 145.09; निचली सीमा 144.90; पैटर्न की चौड़ाई 18 पॉइंट्स है। सेल ट्रेडों को 144.90 की निचली सीमा के
M5 और M15 समय सीमा में अधिक फाल्स एंट्री पॉइंट्स हो सकते हैं।
Open chart in a new window
ट्रिपल बॉटम
was formed on 02.05 at 21:45:21 (UTC+0)
signal strength 1 of 5

ट्रिपल बॉटम पैटर्न EURGBP M5 पर बना है। इसकी निम्नलिखित विशेषताएं हैं: प्रतिरोध स्तर 0.8515/0.8514; समर्थन स्तर 0.8509/0.8509; चौड़ाई 6 पॉइंट्स है। 0.8515 के प्रतिरोध स्तर के टूटने की स्थिति
M5 और M15 समय सीमा में अधिक फाल्स एंट्री पॉइंट्स हो सकते हैं।
Open chart in a new window


