empty
14.04.2023 04:08 PM
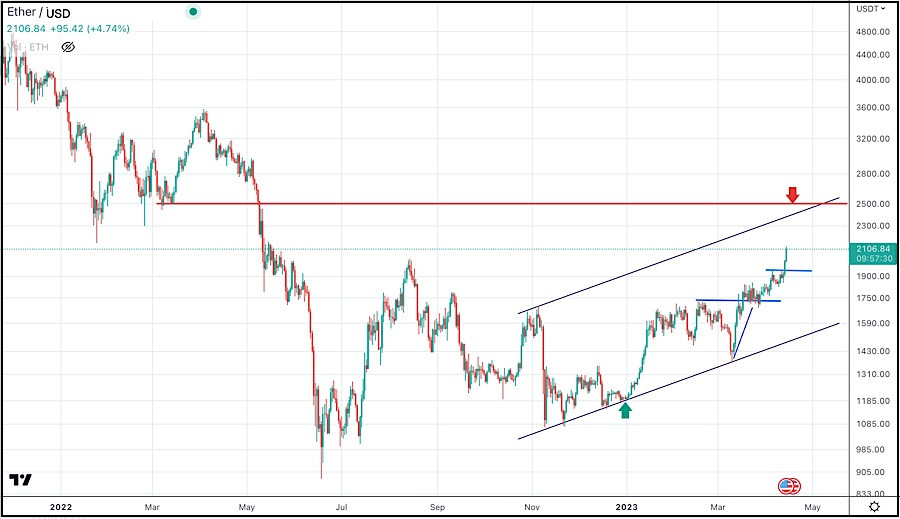
April 14, 2023 : Updated technical analysis of Ethereum/USD.

This image is no longer relevant

Ethereum has been one of the best-performing cryptocurrencies in the market, with significant gains since the beginning of the year. The recent technical analysis of the Ethereum/USD chart shows a potential bullish trend in the near future.

The updated technical analysis of the Ethereum/USD chart indicates that Ethereum has broken out of a key resistance level against USD, which could lead to further gains.

The cryptocurrency is trading within an ascending channel on the USD chart, signaling a potential bullish move.

Ethereum is trading above its 50-day moving average, indicating a bullish trend. However, the Relative Strength Index (RSI) is approaching overbought levels, which indicates a potential correction.

Hence, Ethereum may experience a pullback before continuing its upward trend against USD.

Traders should keep an eye on the price action around the 2500$ level, as it is a key resistance level. A break above this level could lead to further gains towards the 3000$ level. Conversely, a break below the 2000 $ support level could lead to a short-term bearish trend.

In summary, Ethereum against USD chart points to further continuation of the ongoing bullish trend, with a key resistance level at 2500.

Traders should be cautious and wait for confirmation of the bullish trend before entering any long positions.

Recommended Stories

बुधवार, 30 अप्रैल 2025 को USD/JPY मुख्य करेंसी पेयर की इंट्राडे प्राइस मूवमेंट का तकनीकी विश्लेषण।

मुख्य करेंसी पेयर USD/JPY के 4-घंटे के चार्ट पर यह देखा जा सकता है कि स्टोकास्टिक ऑस्सीलेटर संकेतक डबल बॉटम पैटर्न बना रहा है, जबकि USD/JPY की प्राइस मूवमेंट

Arief Makmur 07:55 2025-04-30 UTC+2

बुधवार, 30 अप्रैल 2025 को AUD/JPY क्रॉस करेंसी पेयर की इंट्राडे प्राइस मूवमेंट का तकनीकी विश्लेषण।

AUD/JPY क्रॉस करेंसी पेयर के 4-घंटे के चार्ट पर डाइवरजेंट और डिसेंडिंग ब्रॉडनिंग वेज पैटर्न के प्रकट होने के साथ, हालांकि इसकी कीमत की चाल EMA (21) के नीचे बनी

Arief Makmur 07:53 2025-04-30 UTC+2

**सोना – तकनीकी विश्लेषण अवलोकन**

पिछले सप्ताह, बैल्स ने ऐतिहासिक उच्चतम स्तरों को अपडेट किया और 3499.58 पर एक नया अधिकतम एक्सट्रीमम बनाया। इसके बाद, सोना 3346.45 पर दैनिक शॉर्ट-टर्म ट्रेंड के समर्थन की

Evangelos Poulakis 11:21 2025-04-28 UTC+2

नैस्डैक 100 इंडेक्स की कीमत की चाल का तकनीकी विश्लेषण, गुरुवार, 24 अप्रैल 2025।

हालांकि 4-घंटे के चार्ट पर नैस्डैक 100 इंडेक्स साइडवेज़ (रुका हुआ) है, लेकिन इसका रेंज काफ़ी बड़ा है जिससे इंडेक्स में अभी भी एक काफ़ी आशाजनक अवसर मौजूद है। फिलहाल

Arief Makmur 06:56 2025-04-24 UTC+2

चांदी कमोडिटी इंस्ट्रूमेंट की मूल्य गति का तकनीकी विश्लेषण – गुरुवार, 24 अप्रैल 2025।

4-घंटे के चार्ट पर, चांदी कमोडिटी इंस्ट्रूमेंट की स्थिति मजबूत होती दिखाई दे रही है, जिसकी पुष्टि इस बात से होती है कि चांदी की कीमत WMA (30 शिफ्ट 2)

Arief Makmur 06:54 2025-04-24 UTC+2

ऑस्ट्रेलियन डॉलर/जापानी येन (AUD/JPY) क्रॉस करेंसी पेयर की इंट्राडे मूल्य आंदोलन का तकनीकी विश्लेषण, बुधवार, 23 अप्रैल, 2025।

स्टोकास्टिक ऑस्सीलेटर इंडिकेटर और AUD/JPY की मूल्य आंदोलन में डाइवर्जेंस के दिखाई देने के साथ, और AUD/JPY का मूल्य WMA (30 शिफ्ट 2) के ऊपर स्थित है, जो कि

Arief Makmur 11:16 2025-04-23 UTC+2

इंट्राडे मूल्य आंदोलन का तकनीकी विश्लेषण USD/JPY मुख्य करेंसी जोड़े, सोमवार 21 अप्रैल, 2025

मुख्य मुद्रा जोड़ी USD/JPY के मूल्य आंदोलन में स्टोकेस्टिक ऑस्सीलेटर संकेतक के साथ अभिसरण तथा EMA (100) की स्थिति जो मूल्य से ऊपर है, के प्रकट होने पर, निकट भविष्य

Arief Makmur 06:16 2025-04-21 UTC+2

इंट्राडे मूल्य आंदोलन का तकनीकी विश्लेषण EUR/GBP क्रॉस करेंसी जोड़े, सोमवार 21 अप्रैल, 2025

4-घंटे के चार्ट पर दिखाई दे रहा है कि EUR/GBP क्रॉस करेंसी जोड़ी EMA (100) के ऊपर चल रही है, जो दर्शाता है कि इस जोड़ी पर खरीदारों का प्रभुत्व

Arief Makmur 06:14 2025-04-21 UTC+2

USD/CAD का पूर्वानुमान 17 अप्रैल, 2025 के लिए

USD/CAD के दैनिक चार्ट पर, मार्लिन ऑस्सीलेटर यह संकेत देता है कि मूल्य एक संभावित ऊर्ध्वगामी पलटाव के लिए तैयार है। नीचे 1.3746 का लक्ष्य स्तर और मूल्य चैनल की

Laurie Bailey 11:41 2025-04-17 UTC+2

GBP/USD पूर्वानुमान – 17 अप्रैल, 2025 के लिए।

कल, ब्रिटेन ने मार्च महीने के लिए मुद्रास्फीति के आंकड़े जारी किए। कोर सीपीआई साल-दर-साल 3.0% से घटकर 2.8% हो गई, और हेडलाइन सीपीआई 2.8% से गिरकर 2.6%

Laurie Bailey 11:37 2025-04-17 UTC+2
अभी बात नहीं कर सकते?
अपना प्रश्न पूछें बातचीत.
 

Dear visitor,

Your IP address shows that you are currently located in the USA. If you are a resident of the United States, you are prohibited from using the services of InstaFintech Group including online trading, online transfers, deposit/withdrawal of funds, etc.

If you think you are seeing this message by mistake and your location is not the US, kindly proceed to the website. Otherwise, you must leave the website in order to comply with government restrictions.

Why does your IP address show your location as the USA?

  • - you are using a VPN provided by a hosting company based in the United States;
  • - your IP does not have proper WHOIS records;
  • - an error occurred in the WHOIS geolocation database.

Please confirm whether you are a US resident or not by clicking the relevant button below. If you choose the wrong option, being a US resident, you will not be able to open an account with InstaTrade anyway.

We are sorry for any inconvenience caused by this message.