

Pola sebenarnya

Triple Top
was formed on 28.04 at 06:30:06 (UTC+0)
signal strength 3 of 5
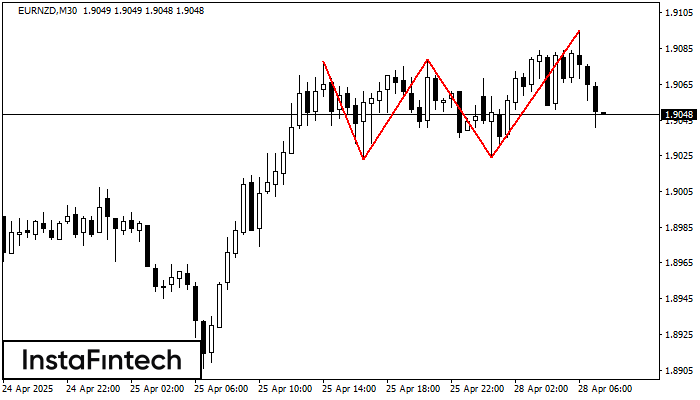
The Triple Top pattern has formed on the chart of the EURNZD M30 trading instrument. It is a reversal pattern featuring the following characteristics: resistance level -17, support level -1, and pattern’s width 55. Forecast If the price breaks through the support level 1.9023, it is likely to move further down to 1.9049.
Lihat juga
- All
- All
- Bearish Rectangle
- Bearish Symmetrical Triangle
- Bearish Symmetrical Triangle
- Bullish Rectangle
- Double Top
- Double Top
- Triple Bottom
- Triple Bottom
- Triple Top
- Triple Top
- All
- All
- Buy
- Sale
- All
- 1
- 2
- 3
- 4
- 5
Double Top
was formed on 02.05 at 03:00:24 (UTC+0)
signal strength 2 of 5
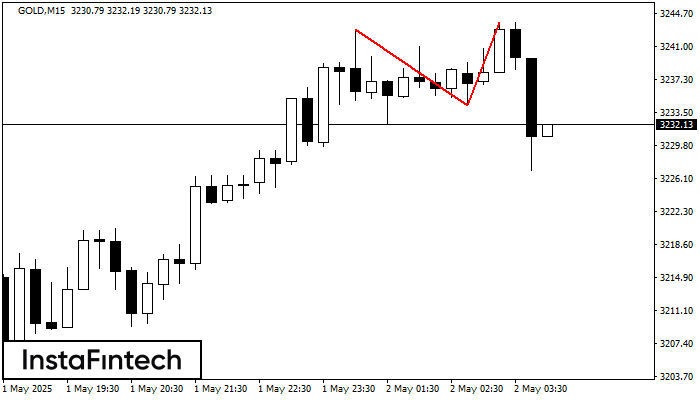
On the chart of GOLD M15 the Double Top reversal pattern has been formed. Characteristics: the upper boundary 3243.76; the lower boundary 3234.33; the width of the pattern 943 points
The M5 and M15 time frames may have more false entry points.
Open chart in a new window
Double Bottom
was formed on 02.05 at 03:00:14 (UTC+0)
signal strength 1 of 5
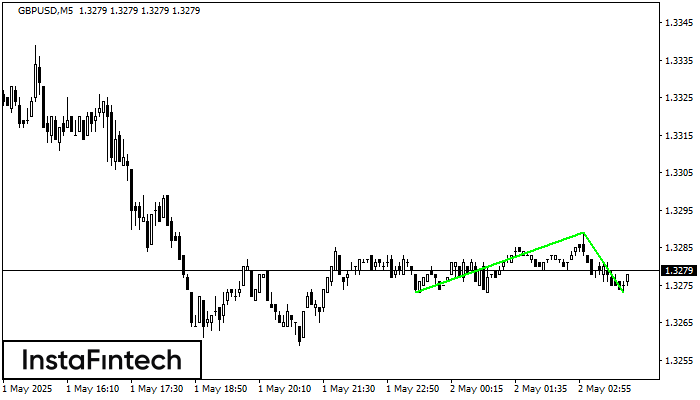
The Double Bottom pattern has been formed on GBPUSD M5. This formation signals a reversal of the trend from downwards to upwards. The signal is that a buy trade should
The M5 and M15 time frames may have more false entry points.
Open chart in a new window
Bullish Flag
was formed on 02.05 at 02:50:29 (UTC+0)
signal strength 1 of 5
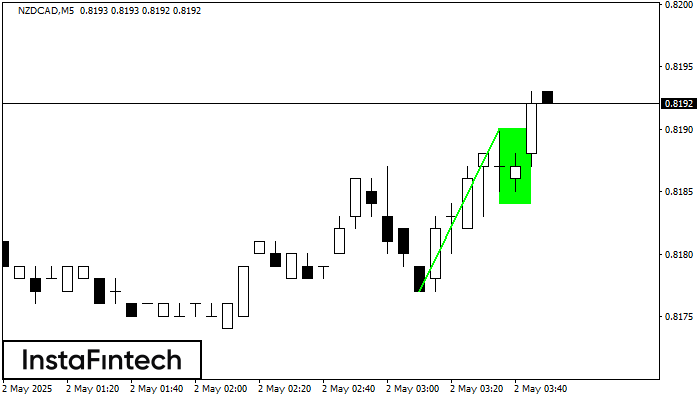
The Bullish Flag pattern has been formed on NZDCAD at M5. The lower boundary of the pattern is located at 0.8184/0.8184, while the higher boundary lies at 0.8190/0.8190. The projection
The M5 and M15 time frames may have more false entry points.
Open chart in a new window


