

Pola sebenarnya

Triple Bottom
was formed on 27.04 at 19:30:44 (UTC+0)
signal strength 3 of 5
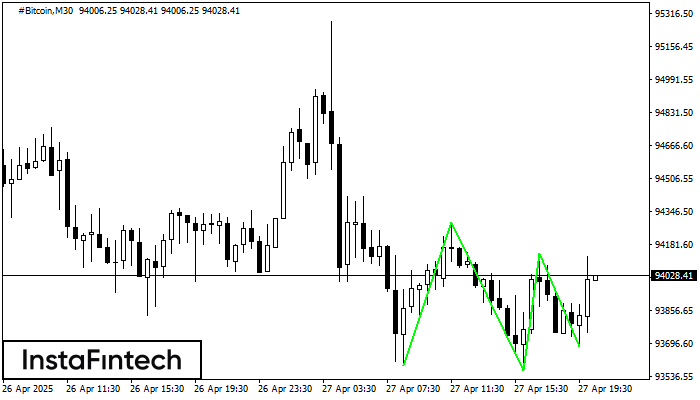
The Triple Bottom pattern has formed on the chart of #Bitcoin M30. Features of the pattern: The lower line of the pattern has coordinates 94291.97 with the upper limit 94291.97/94136.56, the projection of the width is 70503 points. The formation of the Triple Bottom pattern most likely indicates a change in the trend from downward to upward. This means that in the event of a breakdown of the resistance level 93586.94, the price is most likely to continue the upward movement.
- All
- All
- Bearish Rectangle
- Bearish Symmetrical Triangle
- Bearish Symmetrical Triangle
- Bullish Rectangle
- Double Top
- Double Top
- Triple Bottom
- Triple Bottom
- Triple Top
- Triple Top
- All
- All
- Buy
- Sale
- All
- 1
- 2
- 3
- 4
- 5
Teratas Ganda
was formed on 02.05 at 20:15:13 (UTC+0)
signal strength 1 of 5
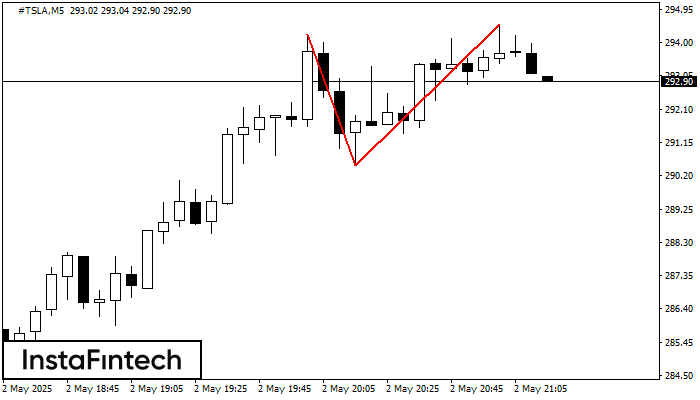
Pola reversal Teratas Ganda telah terbentuk pada #TSLA M5. Karakteristik: batas atas 294.22; batas bawah 290.48; lebar pola 404 poin. Transaksi jual lebih baik dibuka di bawah batas bawah 290.48
Rangka waktu M5 dan M15 mungkin memiliki lebih dari titik entri yang keliru.
Open chart in a new window
Teratas Ganda
was formed on 02.05 at 20:15:11 (UTC+0)
signal strength 1 of 5
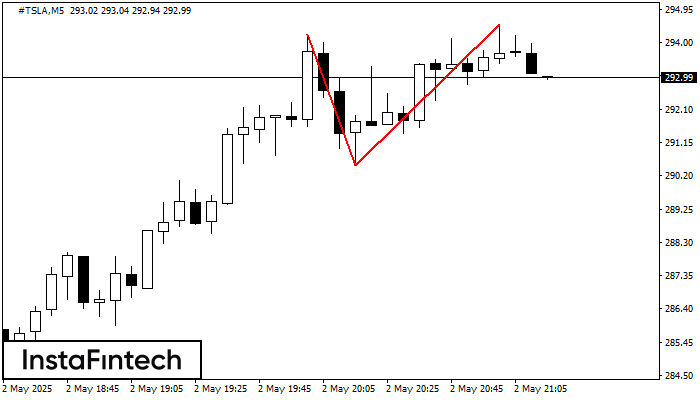
Pola reversal Teratas Ganda telah terbentuk pada #TSLA M5. Karakteristik: batas atas 294.22; batas bawah 290.48; lebar pola 404 poin. Transaksi jual lebih baik dibuka di bawah batas bawah 290.48
Rangka waktu M5 dan M15 mungkin memiliki lebih dari titik entri yang keliru.
Open chart in a new window
Teratas Ganda
was formed on 02.05 at 19:55:12 (UTC+0)
signal strength 1 of 5
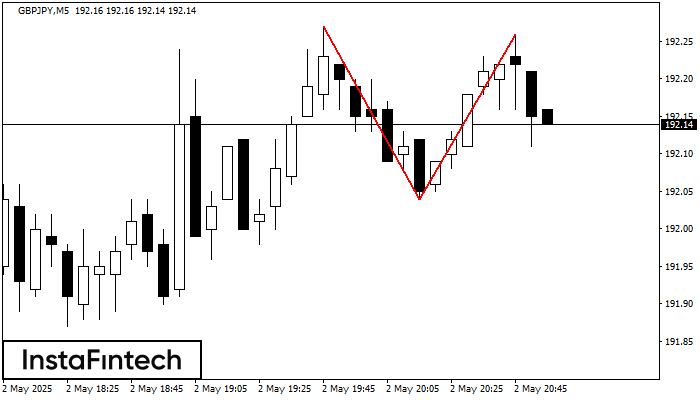
Pada grafik GBPJPY M5 pola reversal Teratas Ganda telah terbentuk. Karakteristik: batas atas 192.26; batas bawah 192.04; lebar pola 22 poin. Sinyal: tembusan ke batas bawah akan menyebabkan kelanjutan tren
Rangka waktu M5 dan M15 mungkin memiliki lebih dari titik entri yang keliru.
Open chart in a new window


