

Pola sebenarnya

Bullish pennant
was formed on 23.04 at 07:10:00 (UTC+0)
signal strength 1 of 5
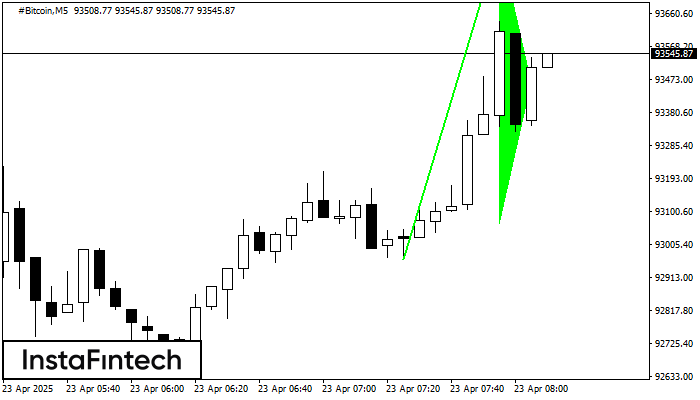
The Bullish pennant signal – Trading instrument #Bitcoin M5, continuation pattern. Forecast: it is possible to set up a buy position above the pattern’s high of 93868.36, with the prospect of the next move being a projection of the flagpole height.
The M5 and M15 time frames may have more false entry points.
- All
- All
- Bearish Rectangle
- Bearish Symmetrical Triangle
- Bearish Symmetrical Triangle
- Bullish Rectangle
- Double Top
- Double Top
- Triple Bottom
- Triple Bottom
- Triple Top
- Triple Top
- All
- All
- Buy
- Sale
- All
- 1
- 2
- 3
- 4
- 5
Double Bottom
was formed on 06.05 at 06:30:39 (UTC+0)
signal strength 3 of 5
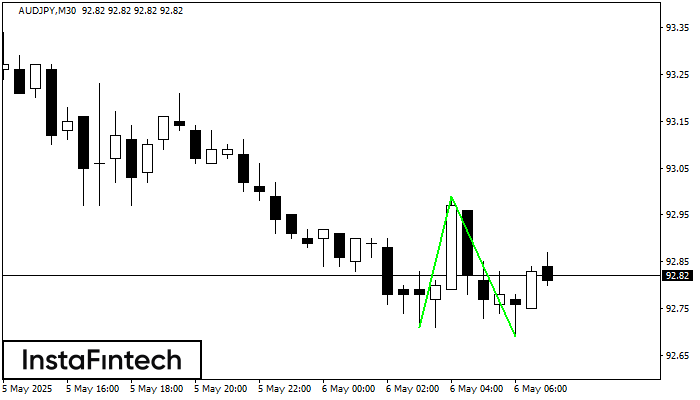
The Double Bottom pattern has been formed on AUDJPY M30. This formation signals a reversal of the trend from downwards to upwards. The signal is that a buy trade should
Open chart in a new window
Double Bottom
was formed on 06.05 at 06:00:36 (UTC+0)
signal strength 2 of 5
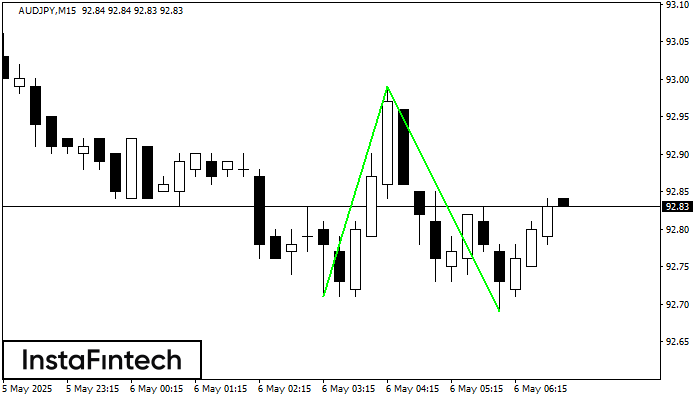
The Double Bottom pattern has been formed on AUDJPY M15. This formation signals a reversal of the trend from downwards to upwards. The signal is that a buy trade should
The M5 and M15 time frames may have more false entry points.
Open chart in a new window
Double Bottom
was formed on 06.05 at 03:45:33 (UTC+0)
signal strength 1 of 5
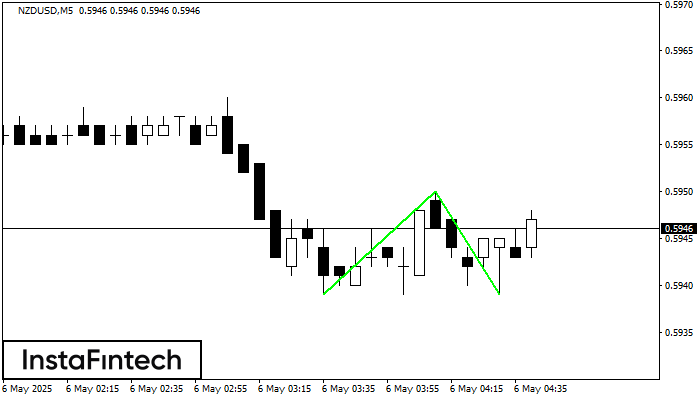
The Double Bottom pattern has been formed on NZDUSD M5; the upper boundary is 0.5950; the lower boundary is 0.5939. The width of the pattern is 11 points. In case
The M5 and M15 time frames may have more false entry points.
Open chart in a new window


