

Pola sebenarnya

Triple Top
was formed on 22.04 at 19:15:08 (UTC+0)
signal strength 1 of 5
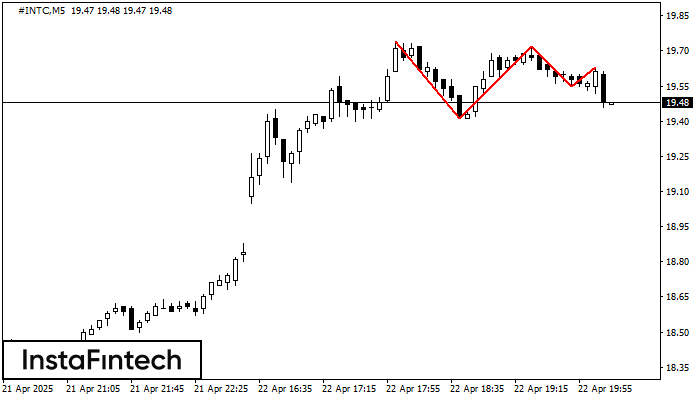
The Triple Top pattern has formed on the chart of the #INTC M5. Features of the pattern: borders have an ascending angle; the lower line of the pattern has the coordinates 19.41/19.55 with the upper limit 19.74/19.63; the projection of the width is 33 points. The formation of the Triple Top figure most likely indicates a change in the trend from upward to downward. This means that in the event of a breakdown of the support level of 19.41, the price is most likely to continue the downward movement.
The M5 and M15 time frames may have more false entry points.
Lihat juga
- All
- All
- Bearish Rectangle
- Bearish Symmetrical Triangle
- Bearish Symmetrical Triangle
- Bullish Rectangle
- Double Top
- Double Top
- Triple Bottom
- Triple Bottom
- Triple Top
- Triple Top
- All
- All
- Buy
- Sale
- All
- 1
- 2
- 3
- 4
- 5
Segitiga Simetris Bullish
was formed on 05.05 at 05:57:59 (UTC+0)
signal strength 2 of 5
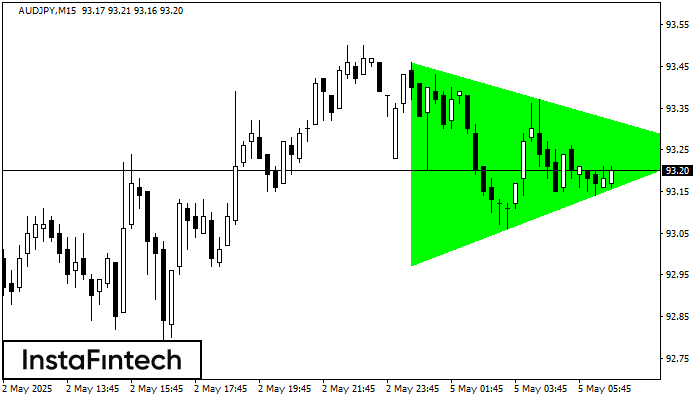
Menurut Grafik dari M15, AUDJPY dibentuk pola Segitiga Simetris Bullish. Batas yang lebih rendah dari pola menyentuh kordinat 92.97/93.25 dimana batas atas berada sepanjang 93.46/93.25. Jika pola Segitiga Simetris Bullish
Rangka waktu M5 dan M15 mungkin memiliki lebih dari titik entri yang keliru.
Open chart in a new window
Teratas Ganda
was formed on 05.05 at 05:10:19 (UTC+0)
signal strength 1 of 5

Pola Teratas Ganda telah terbentuk pada NZDJPY M5. Pola ini menandakan bahwa tren telah berubah dari kenaikan menjadi penurunan. Mungkin, jika dasar pola di 86.15 ditembus, maka pergerakan menurun akan
Rangka waktu M5 dan M15 mungkin memiliki lebih dari titik entri yang keliru.
Open chart in a new window
Teratas Ganda
was formed on 05.05 at 04:15:20 (UTC+0)
signal strength 1 of 5
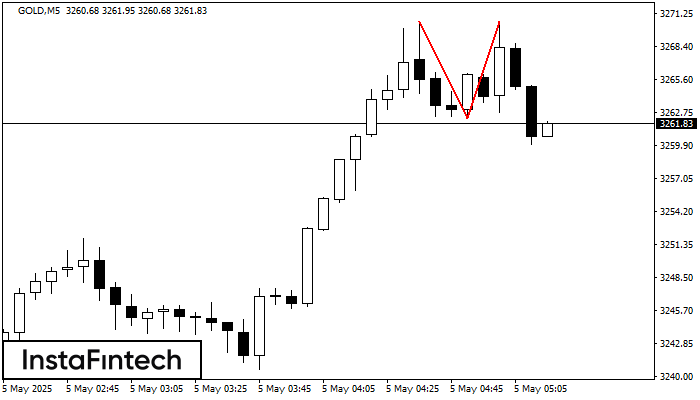
Pola Teratas Ganda telah terbentuk pada GOLD M5. Pola ini menandakan bahwa tren telah berubah dari kenaikan menjadi penurunan. Mungkin, jika dasar pola di 3262.20 ditembus, maka pergerakan menurun akan
Rangka waktu M5 dan M15 mungkin memiliki lebih dari titik entri yang keliru.
Open chart in a new window


