

Pola sebenarnya

Double Top
was formed on 22.04 at 19:05:20 (UTC+0)
signal strength 1 of 5
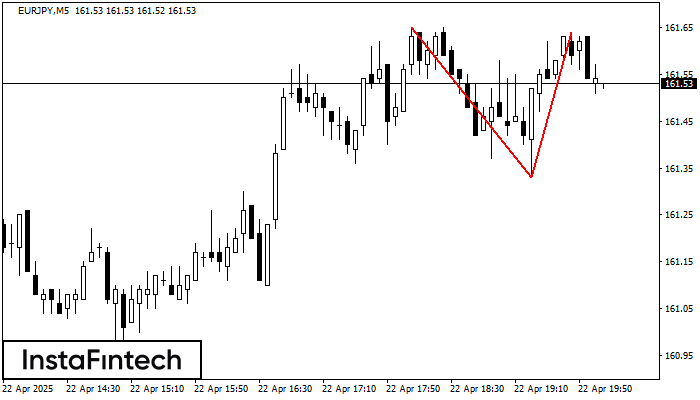
The Double Top pattern has been formed on EURJPY M5. It signals that the trend has been changed from upwards to downwards. Probably, if the base of the pattern 161.33 is broken, the downward movement will continue.
The M5 and M15 time frames may have more false entry points.
Lihat juga
- All
- All
- Bearish Rectangle
- Bearish Symmetrical Triangle
- Bearish Symmetrical Triangle
- Bullish Rectangle
- Double Top
- Double Top
- Triple Bottom
- Triple Bottom
- Triple Top
- Triple Top
- All
- All
- Buy
- Sale
- All
- 1
- 2
- 3
- 4
- 5
Double Bottom
was formed on 06.05 at 14:05:19 (UTC+0)
signal strength 1 of 5
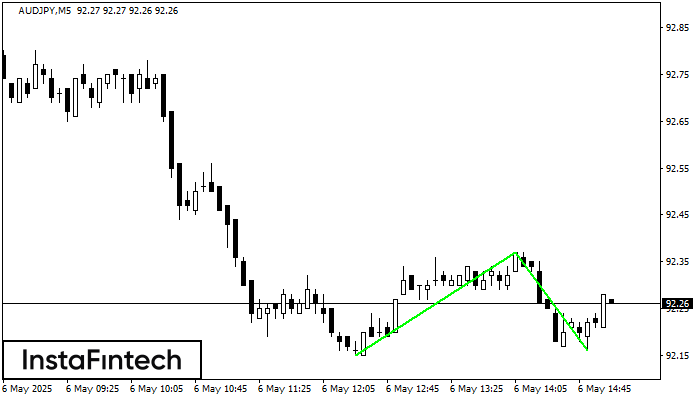
The Double Bottom pattern has been formed on AUDJPY M5. Characteristics: the support level 92.15; the resistance level 92.37; the width of the pattern 22 points. If the resistance level
The M5 and M15 time frames may have more false entry points.
Open chart in a new window
Triple Top
was formed on 06.05 at 13:35:12 (UTC+0)
signal strength 1 of 5
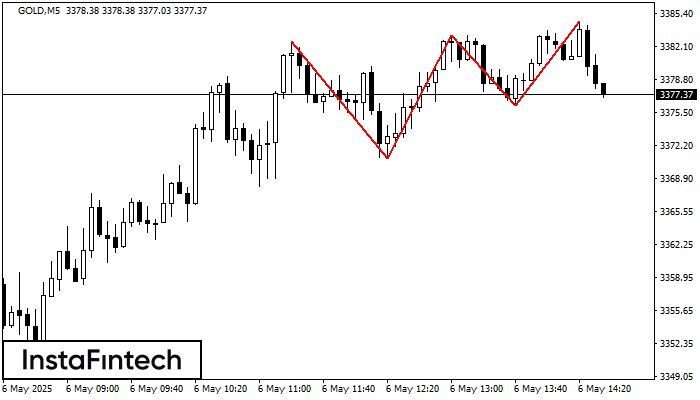
The Triple Top pattern has formed on the chart of the GOLD M5 trading instrument. It is a reversal pattern featuring the following characteristics: resistance level -193, support level -528
The M5 and M15 time frames may have more false entry points.
Open chart in a new window
Double Bottom
was formed on 06.05 at 13:10:34 (UTC+0)
signal strength 1 of 5
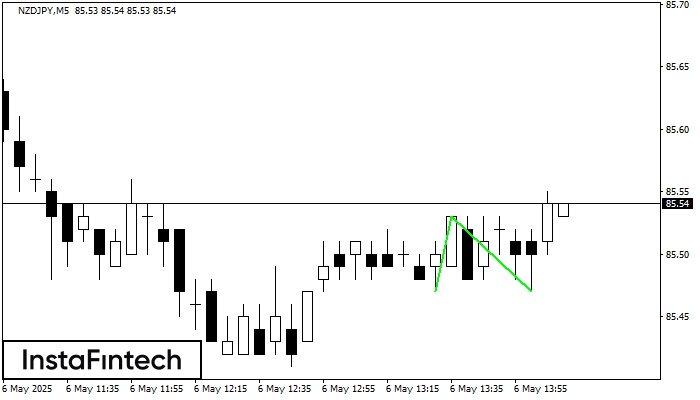
The Double Bottom pattern has been formed on NZDJPY M5. This formation signals a reversal of the trend from downwards to upwards. The signal is that a buy trade should
The M5 and M15 time frames may have more false entry points.
Open chart in a new window


