

Pola sebenarnya

Bullish Flag
was formed on 22.04 at 15:59:28 (UTC+0)
signal strength 1 of 5
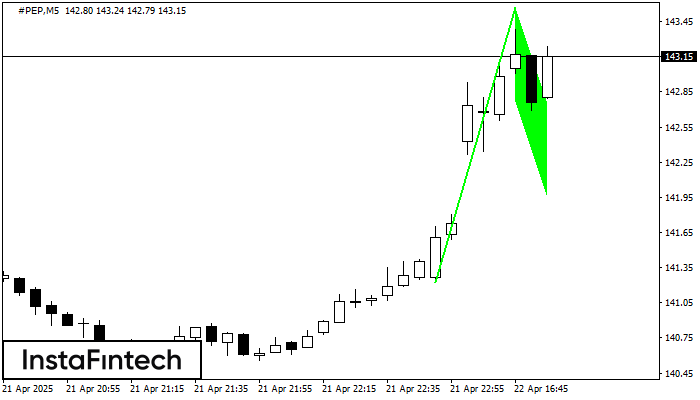
The Bullish Flag pattern has been formed on the chart #PEP M5 which signals that the upward trend will continue. Signals: а break of the peak at 143.57 may push the price higher, and the rise will be the projection of the pole.
The M5 and M15 time frames may have more false entry points.
- All
- All
- Bearish Rectangle
- Bearish Symmetrical Triangle
- Bearish Symmetrical Triangle
- Bullish Rectangle
- Double Top
- Double Top
- Triple Bottom
- Triple Bottom
- Triple Top
- Triple Top
- All
- All
- Buy
- Sale
- All
- 1
- 2
- 3
- 4
- 5
Triple Top
was formed on 05.05 at 10:59:43 (UTC+0)
signal strength 4 of 5
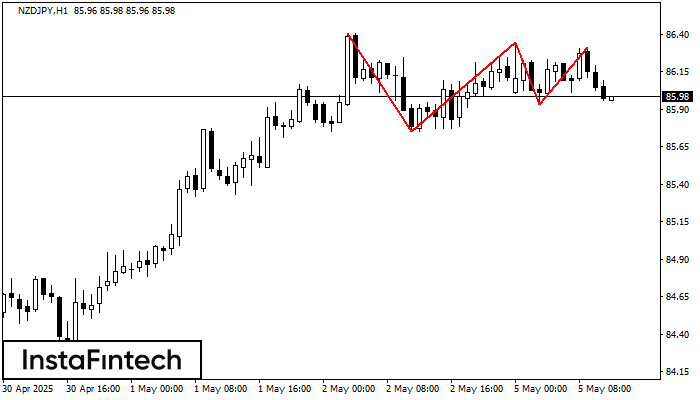
The Triple Top pattern has formed on the chart of the NZDJPY H1. Features of the pattern: borders have an ascending angle; the lower line of the pattern
Open chart in a new window
Bullish Rectangle
was formed on 05.05 at 10:31:43 (UTC+0)
signal strength 1 of 5
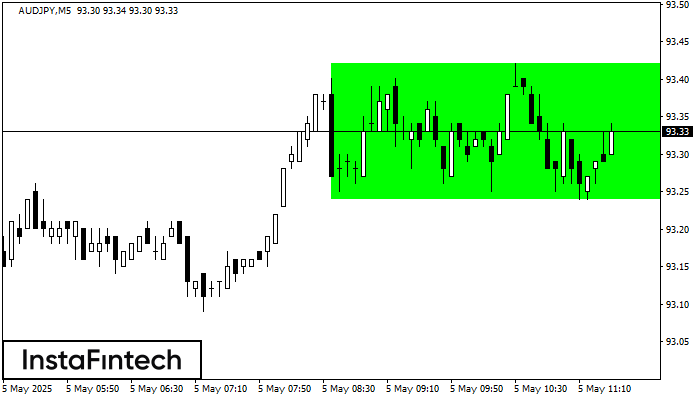
According to the chart of M5, AUDJPY formed the Bullish Rectangle. The pattern indicates a trend continuation. The upper border is 93.42, the lower border is 93.24. The signal means
The M5 and M15 time frames may have more false entry points.
Open chart in a new window
Triple Bottom
was formed on 05.05 at 10:00:09 (UTC+0)
signal strength 3 of 5
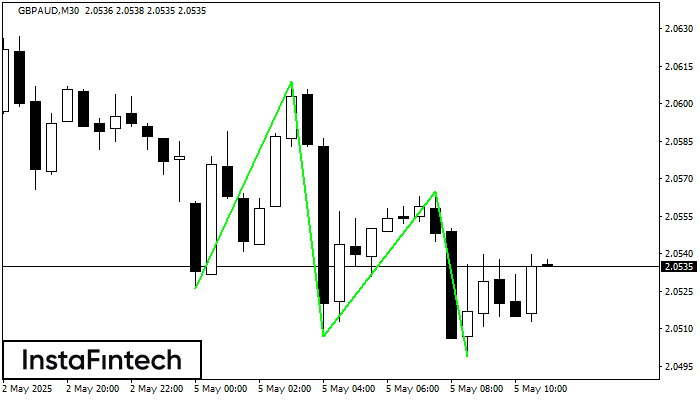
The Triple Bottom pattern has formed on the chart of GBPAUD M30. Features of the pattern: The lower line of the pattern has coordinates 2.0609 with the upper limit 2.0609/2.0565
Open chart in a new window


