

Pola sebenarnya

Bearish Rectangle
was formed on 22.04 at 06:31:47 (UTC+0)
signal strength 1 of 5
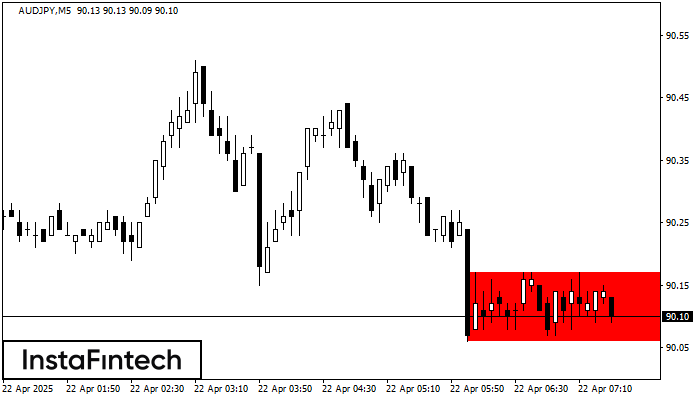
According to the chart of M5, AUDJPY formed the Bearish Rectangle. This type of a pattern indicates a trend continuation. It consists of two levels: resistance 90.17 - 0.00 and support 90.06 – 90.06. In case the resistance level 90.06 - 90.06 is broken, the instrument is likely to follow the bearish trend.
The M5 and M15 time frames may have more false entry points.
- All
- All
- Bearish Rectangle
- Bearish Symmetrical Triangle
- Bearish Symmetrical Triangle
- Bullish Rectangle
- Double Top
- Double Top
- Triple Bottom
- Triple Bottom
- Triple Top
- Triple Top
- All
- All
- Buy
- Sale
- All
- 1
- 2
- 3
- 4
- 5
Kepala dan Bahu Terbalik
was formed on 02.05 at 12:00:11 (UTC+0)
signal strength 4 of 5
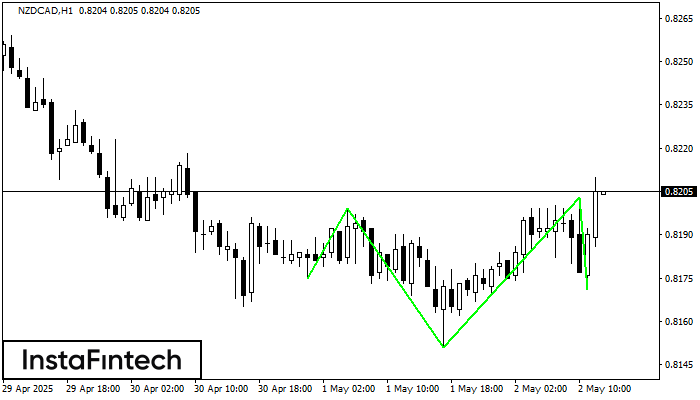
Menurut grafik H1, NZDCAD menghasilkan pola yang disebut Kepala dan Bahu Terbalik. The Head ditetapkan di 0.8151 sementara garis median The Neck ditetapkan di 0.8199/0.8203. Formasi Pola Kepala dan Bahu
Open chart in a new window
Teratas Triple
was formed on 02.05 at 11:00:30 (UTC+0)
signal strength 4 of 5
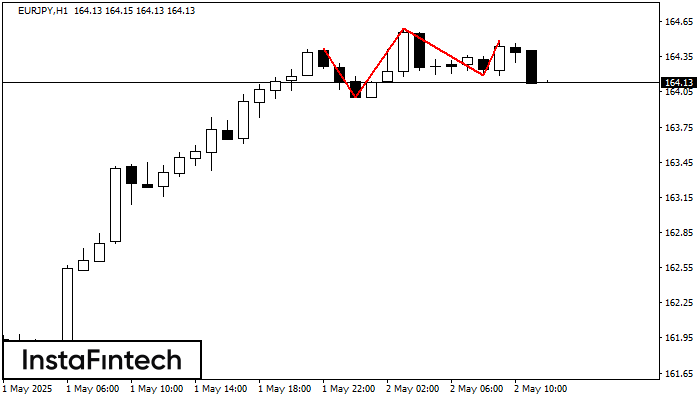
Pola Teratas Triple telah terbentuk pada grafik instrumen trading EURJPY H1. Pola tersebut merupakan pola reversal menampilkan karakteristik berikut: level resistance -7, levek support -19, dan lebar pola 42. Prakiraan
Open chart in a new window
Teratas Triple
was formed on 02.05 at 11:00:11 (UTC+0)
signal strength 3 of 5
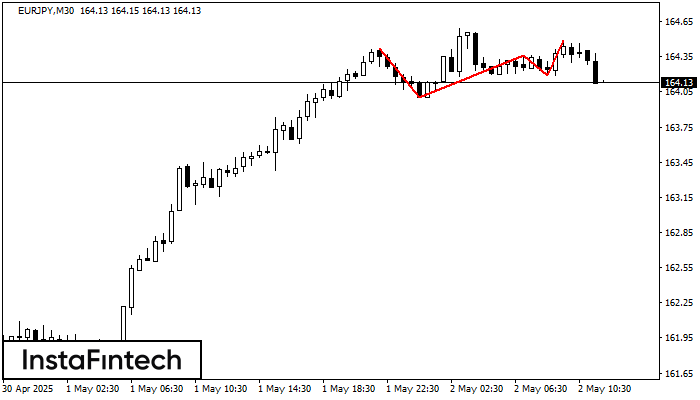
Pola Teratas Triple telah terbentuk pada grafik instrumen trading EURJPY M30. Pola tersebut merupakan pola reversal menampilkan karakteristik berikut: level resistance -7, levek support -19, dan lebar pola 42. Prakiraan
Open chart in a new window


