

Pola sebenarnya

Inverse Head and Shoulder
was formed on 22.04 at 00:00:27 (UTC+0)
signal strength 1 of 5

According to the chart of M5, AUDUSD produced the pattern termed the Inverse Head and Shoulder. The Head is fixed at 0.6402 while the median line of the Neck is set at 0.6415/0.6416. The formation of the Inverse Head and Shoulder Pattern clearly indicates a reversal of the downward trend. In means that in case the scenario comes true, the price of AUDUSD will go towards 0.6431.
The M5 and M15 time frames may have more false entry points.
- All
- All
- Bearish Rectangle
- Bearish Symmetrical Triangle
- Bearish Symmetrical Triangle
- Bullish Rectangle
- Double Top
- Double Top
- Triple Bottom
- Triple Bottom
- Triple Top
- Triple Top
- All
- All
- Buy
- Sale
- All
- 1
- 2
- 3
- 4
- 5
Bawah Ganda
was formed on 02.05 at 04:35:10 (UTC+0)
signal strength 1 of 5
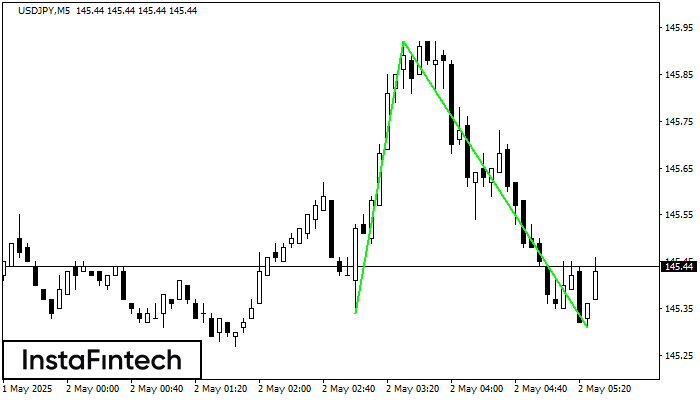
Pola Bawah Ganda telah terbentuk pada USDJPY M5. Formasi ini mensinyalkan reversal tren dari arah penurunan ke arah kenaikan. Sinyal menunjukkan bahwa transaksi beli harus dibuka setelah batas atas pola
Rangka waktu M5 dan M15 mungkin memiliki lebih dari titik entri yang keliru.
Open chart in a new window
Segitiga Simetris Bearish
was formed on 02.05 at 03:46:47 (UTC+0)
signal strength 1 of 5
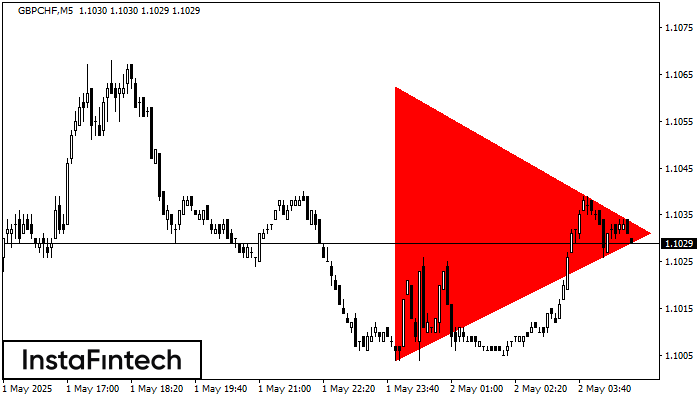
Menurut Grafik dari M5, GBPCHF dibentuk pola Segitiga Simetris Bearish. Deskripsi: Batas yang lebih rendah adalah 1.1004/1.1031 dan batas atas adalah 1.1063/1.1031. Lebar pola diukur dalam grafik di -59 pips
Rangka waktu M5 dan M15 mungkin memiliki lebih dari titik entri yang keliru.
Open chart in a new window
Teratas Ganda
was formed on 02.05 at 03:00:24 (UTC+0)
signal strength 2 of 5
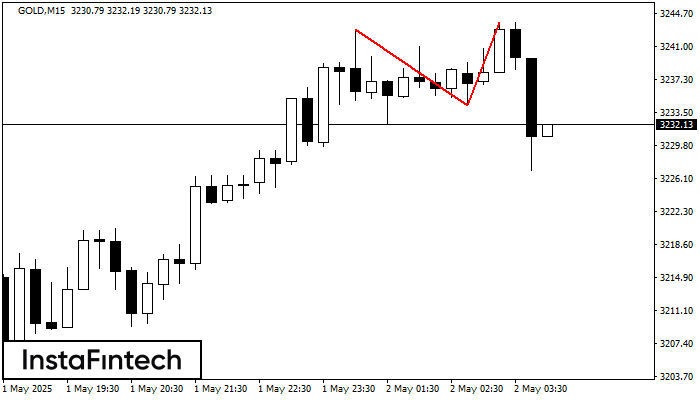
Pada grafik GOLD M15 pola reversal Teratas Ganda telah terbentuk. Karakteristik: batas atas 3243.76; batas bawah 3234.33; lebar pola 943 poin. Sinyal: tembusan ke batas bawah akan menyebabkan kelanjutan tren
Rangka waktu M5 dan M15 mungkin memiliki lebih dari titik entri yang keliru.
Open chart in a new window


