

Pola sebenarnya

Double Top
was formed on 21.04 at 22:55:31 (UTC+0)
signal strength 1 of 5
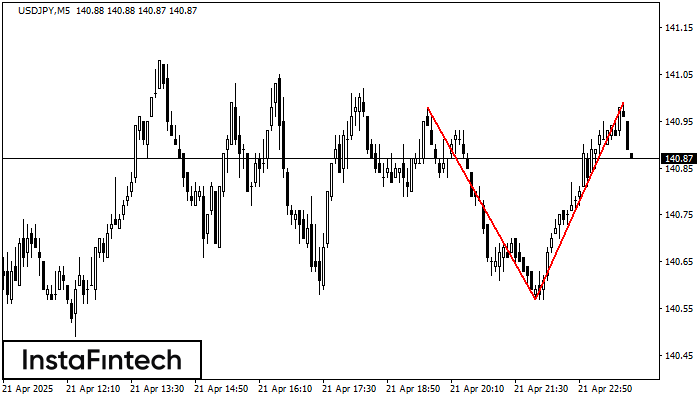
The Double Top reversal pattern has been formed on USDJPY M5. Characteristics: the upper boundary 140.98; the lower boundary 140.57; the width of the pattern is 42 points. Sell trades are better to be opened below the lower boundary 140.57 with a possible movements towards the 140.42 level.
The M5 and M15 time frames may have more false entry points.
- All
- All
- Bearish Rectangle
- Bearish Symmetrical Triangle
- Bearish Symmetrical Triangle
- Bullish Rectangle
- Double Top
- Double Top
- Triple Bottom
- Triple Bottom
- Triple Top
- Triple Top
- All
- All
- Buy
- Sale
- All
- 1
- 2
- 3
- 4
- 5
Bullish Symmetrical Triangle
was formed on 02.05 at 13:25:45 (UTC+0)
signal strength 1 of 5
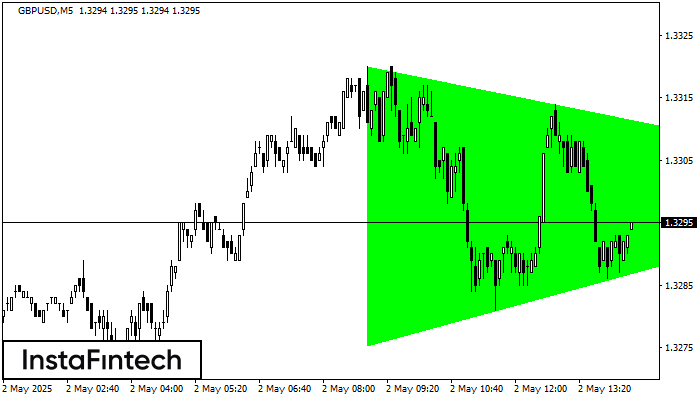
According to the chart of M5, GBPUSD formed the Bullish Symmetrical Triangle pattern, which signals the trend will continue. Description. The upper border of the pattern touches the coordinates 1.3320/1.3301
The M5 and M15 time frames may have more false entry points.
Open chart in a new window
Bullish Rectangle
was formed on 02.05 at 13:01:57 (UTC+0)
signal strength 1 of 5
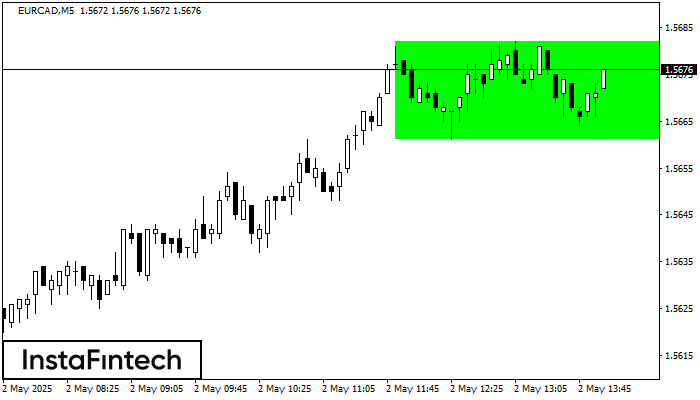
According to the chart of M5, EURCAD formed the Bullish Rectangle which is a pattern of a trend continuation. The pattern is contained within the following borders: the lower border
The M5 and M15 time frames may have more false entry points.
Open chart in a new window
Bearish Symmetrical Triangle
was formed on 02.05 at 12:46:09 (UTC+0)
signal strength 2 of 5
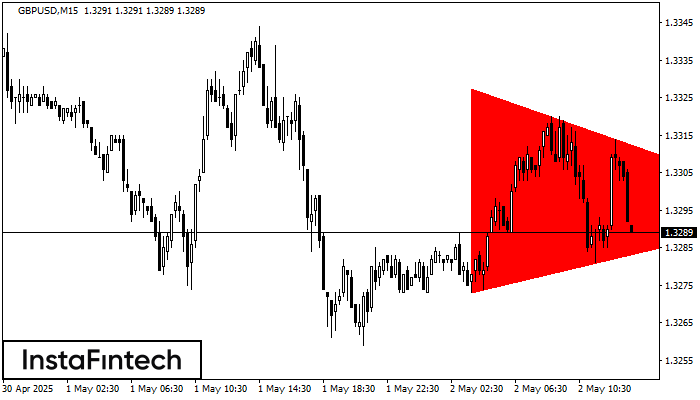
According to the chart of M15, GBPUSD formed the Bearish Symmetrical Triangle pattern. Description: The lower border is 1.3273/1.3295 and upper border is 1.3328/1.3295. The pattern width is measured
The M5 and M15 time frames may have more false entry points.
Open chart in a new window


