

Pola sebenarnya

Bearish Symmetrical Triangle
was formed on 21.04 at 13:29:27 (UTC+0)
signal strength 1 of 5

According to the chart of M5, AUDCHF formed the Bearish Symmetrical Triangle pattern. Description: The lower border is 0.5164/0.5181 and upper border is 0.5203/0.5181. The pattern width is measured on the chart at -39 pips. The formation of the Bearish Symmetrical Triangle pattern evidently signals a continuation of the downward trend. In other words, if the scenario comes true and AUDCHF breaches the lower border, the price could continue its move toward 0.5166.
The M5 and M15 time frames may have more false entry points.
- All
- All
- Bearish Rectangle
- Bearish Symmetrical Triangle
- Bearish Symmetrical Triangle
- Bullish Rectangle
- Double Top
- Double Top
- Triple Bottom
- Triple Bottom
- Triple Top
- Triple Top
- All
- All
- Buy
- Sale
- All
- 1
- 2
- 3
- 4
- 5
Teratas Ganda
was formed on 02.05 at 20:30:06 (UTC+0)
signal strength 2 of 5

Pola reversal Teratas Ganda telah terbentuk pada #NTDOY M15. Karakteristik: batas atas 21.67; batas bawah 21.54; lebar pola 12 poin. Transaksi jual lebih baik dibuka di bawah batas bawah 21.54
Rangka waktu M5 dan M15 mungkin memiliki lebih dari titik entri yang keliru.
Open chart in a new window
Teratas Ganda
was formed on 02.05 at 20:30:05 (UTC+0)
signal strength 2 of 5
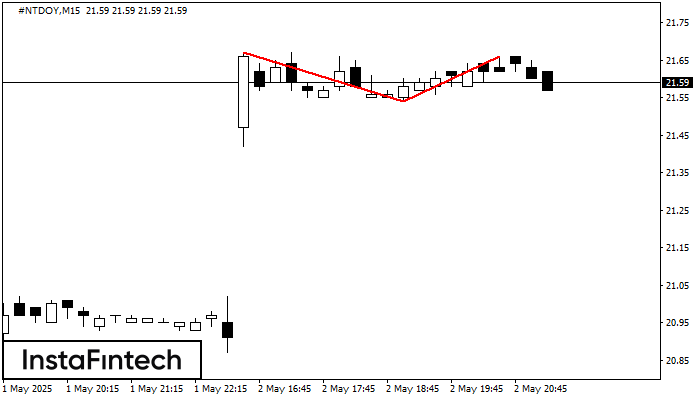
Pada grafik #NTDOY M15 pola reversal Teratas Ganda telah terbentuk. Karakteristik: batas atas 21.66; batas bawah 21.54; lebar pola 12 poin. Sinyal: tembusan ke batas bawah akan menyebabkan kelanjutan tren
Rangka waktu M5 dan M15 mungkin memiliki lebih dari titik entri yang keliru.
Open chart in a new window
Teratas Ganda
was formed on 02.05 at 20:15:13 (UTC+0)
signal strength 1 of 5
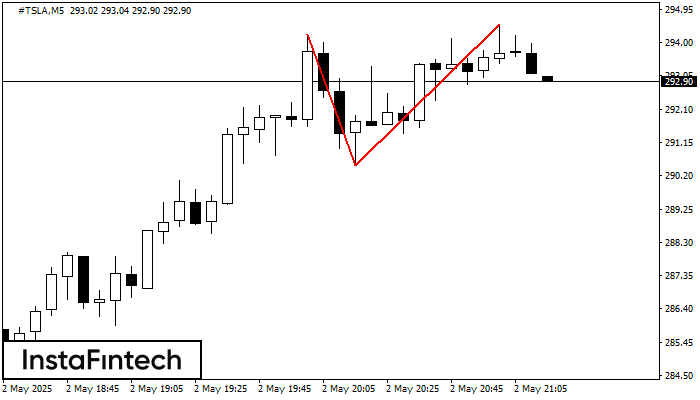
Pola reversal Teratas Ganda telah terbentuk pada #TSLA M5. Karakteristik: batas atas 294.22; batas bawah 290.48; lebar pola 404 poin. Transaksi jual lebih baik dibuka di bawah batas bawah 290.48
Rangka waktu M5 dan M15 mungkin memiliki lebih dari titik entri yang keliru.
Open chart in a new window


