

Pola sebenarnya

Double Bottom
was formed on 20.04 at 18:15:23 (UTC+0)
signal strength 1 of 5

The Double Bottom pattern has been formed on #Bitcoin M5; the upper boundary is 84636.40; the lower boundary is 84234.35. The width of the pattern is 42295 points. In case of a break of the upper boundary 84636.40, a change in the trend can be predicted where the width of the pattern will coincide with the distance to a possible take profit level.
The M5 and M15 time frames may have more false entry points.
- All
- All
- Bearish Rectangle
- Bearish Symmetrical Triangle
- Bearish Symmetrical Triangle
- Bullish Rectangle
- Double Top
- Double Top
- Triple Bottom
- Triple Bottom
- Triple Top
- Triple Top
- All
- All
- Buy
- Sale
- All
- 1
- 2
- 3
- 4
- 5
बुलिश फ्लैग
was formed on 01.05 at 22:00:22 (UTC+0)
signal strength 4 of 5
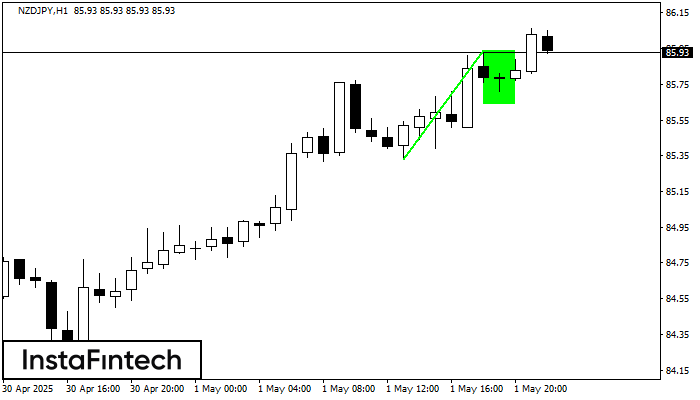
बुलिश फ्लैग पैटर्न जो एक प्रवृत्ति के जारी रहने का संकेत देता है, चार्ट NZDJPY H1 पर बना है। पूर्वानुमान: यदि कीमत 85.94 के पैटर्न की उचाई से ऊपर टूटती
Open chart in a new window
बियरिश आयत
was formed on 01.05 at 21:45:52 (UTC+0)
signal strength 1 of 5
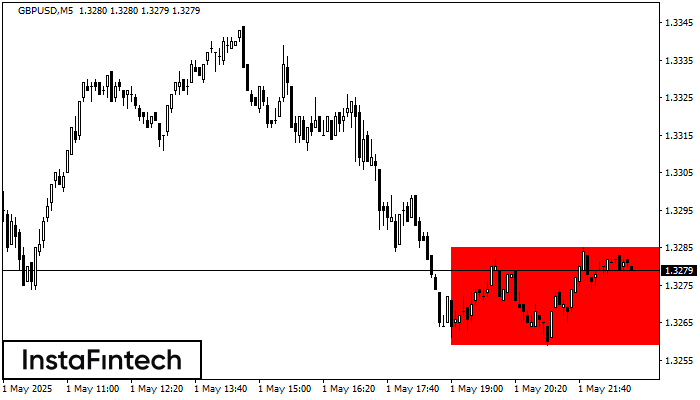
M5 के चार्ट के अनुसार, GBPUSD से बियरिश आयत बना। इस प्रकार का पैटर्न एक प्रवृत्ति निरंतरता को इंगित करता है। इसमें दो स्तर होते हैं: प्रतिरोध 1.3285 - 0.0000
M5 और M15 समय सीमा में अधिक फाल्स एंट्री पॉइंट्स हो सकते हैं।
Open chart in a new window
डबल बॉटम
was formed on 01.05 at 21:40:21 (UTC+0)
signal strength 1 of 5
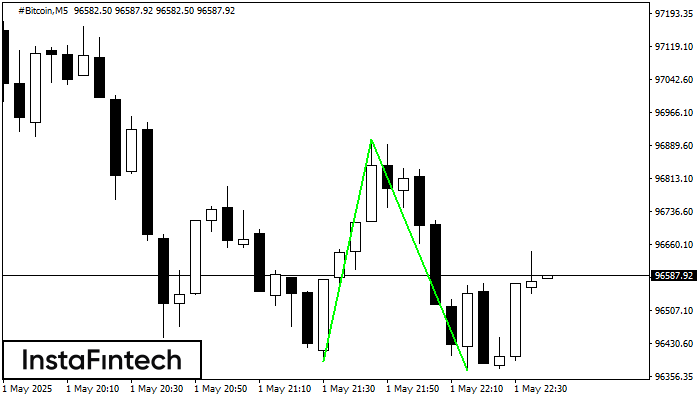
डबल बॉटम पैटर्न #Bitcoin M5 पर बना है। यह फॉर्मेशन नीचे से ऊपर की ओर प्रवृत्ति के उलट होने का संकेत देता है। संकेत यह है कि पैटर्न 96903.54 की
M5 और M15 समय सीमा में अधिक फाल्स एंट्री पॉइंट्स हो सकते हैं।
Open chart in a new window


