

Pola sebenarnya

Bearish Rectangle
was formed on 16.04 at 10:28:36 (UTC+0)
signal strength 4 of 5
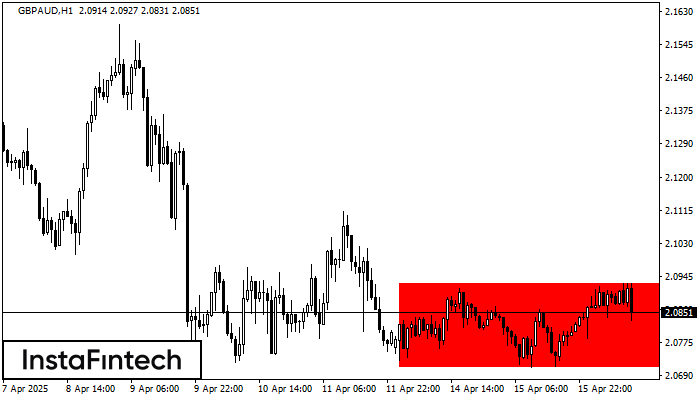
According to the chart of H1, GBPAUD formed the Bearish Rectangle. The pattern indicates a trend continuation. The upper border is 2.0927, the lower border is 2.0711. The signal means that a short position should be opened after fixing a price below the lower border 2.0711 of the Bearish Rectangle.
- All
- All
- Bearish Rectangle
- Bearish Symmetrical Triangle
- Bearish Symmetrical Triangle
- Bullish Rectangle
- Double Top
- Double Top
- Triple Bottom
- Triple Bottom
- Triple Top
- Triple Top
- All
- All
- Buy
- Sale
- All
- 1
- 2
- 3
- 4
- 5
Persegi Bullish
was formed on 09.05 at 22:57:29 (UTC+0)
signal strength 1 of 5

Menurut grafik dari M5, GBPJPY terbentuk Persegi Bullish. Pola menunjukkan kelanjutan tren. Batas atas adalah 193.44, batas lebih rendah adalah 193.24. Sinyal berarti posisi beli harus dibuka diatas batas atas
Rangka waktu M5 dan M15 mungkin memiliki lebih dari titik entri yang keliru.
Open chart in a new window
Bawah Triple
was formed on 09.05 at 22:35:52 (UTC+0)
signal strength 1 of 5

Pola Bawah Triple telah terbentuk pada grafik instrumen trading EURNZD M5. Pola tersebut menandakan perubahan dalam trend dari menurun menjadi naik jika terjadi pemecahan (breakdown) 1.9038/1.9031
Rangka waktu M5 dan M15 mungkin memiliki lebih dari titik entri yang keliru.
Open chart in a new window
Teratas Ganda
was formed on 09.05 at 22:30:52 (UTC+0)
signal strength 1 of 5

Pola reversal Teratas Ganda telah terbentuk pada #Bitcoin M5. Karakteristik: batas atas 103337.20; batas bawah 102845.36; lebar pola 51954 poin. Transaksi jual lebih baik dibuka di bawah batas bawah 102845.36
Rangka waktu M5 dan M15 mungkin memiliki lebih dari titik entri yang keliru.
Open chart in a new window


