

Pola sebenarnya

Double Bottom
was formed on 16.04 at 09:36:01 (UTC+0)
signal strength 1 of 5
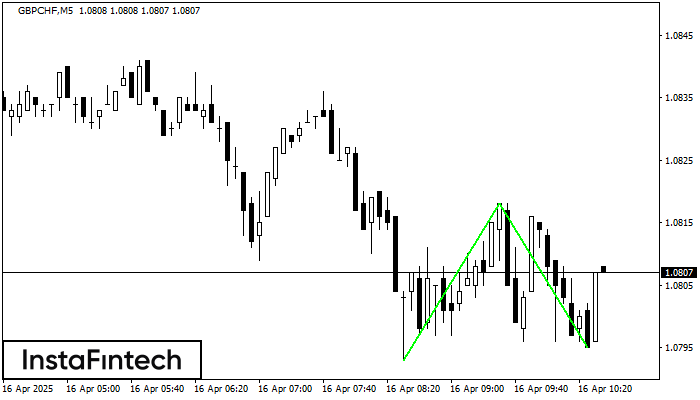
The Double Bottom pattern has been formed on GBPCHF M5. This formation signals a reversal of the trend from downwards to upwards. The signal is that a buy trade should be opened after the upper boundary of the pattern 1.0818 is broken. The further movements will rely on the width of the current pattern 25 points.
The M5 and M15 time frames may have more false entry points.
Lihat juga
- All
- All
- Bearish Rectangle
- Bearish Symmetrical Triangle
- Bearish Symmetrical Triangle
- Bullish Rectangle
- Double Top
- Double Top
- Triple Bottom
- Triple Bottom
- Triple Top
- Triple Top
- All
- All
- Buy
- Sale
- All
- 1
- 2
- 3
- 4
- 5
Bawah Ganda
was formed on 07.05 at 01:00:48 (UTC+0)
signal strength 4 of 5
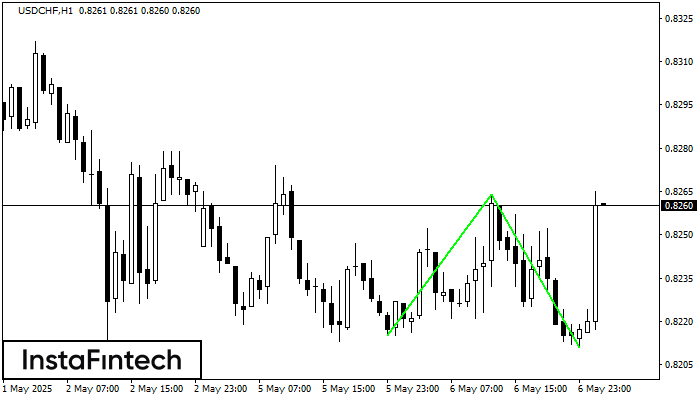
Pola Bawah Ganda telah terbentuk pada USDCHF H1; batas atas di 0.8264; batas bawah di 0.8211. Lebar pola sebesar 49 poin. Jika harga menembus batas atas 0.8264, Perubahan dalam tren
Open chart in a new window
Bawah Ganda
was formed on 07.05 at 01:00:39 (UTC+0)
signal strength 4 of 5
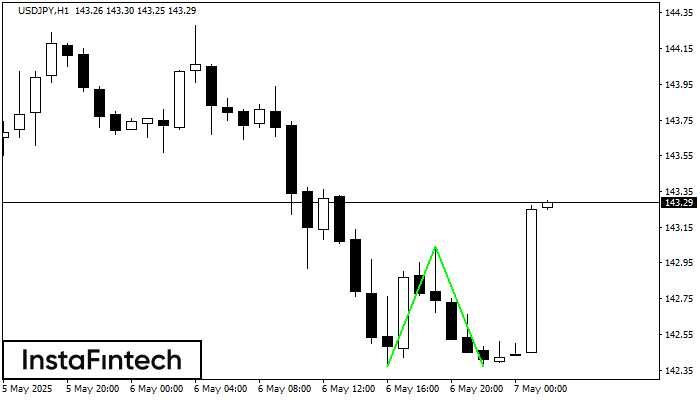
Pola Bawah Ganda telah terbentuk pada USDJPY H1. Karakteristik: level support 142.37; level resistance 143.04; lebar pola 67 poin. Jika level resistance ditembus, perubahan dalam tren dapat diprediksi dengan target
Open chart in a new window
Teratas Triple
was formed on 07.05 at 01:00:22 (UTC+0)
signal strength 4 of 5
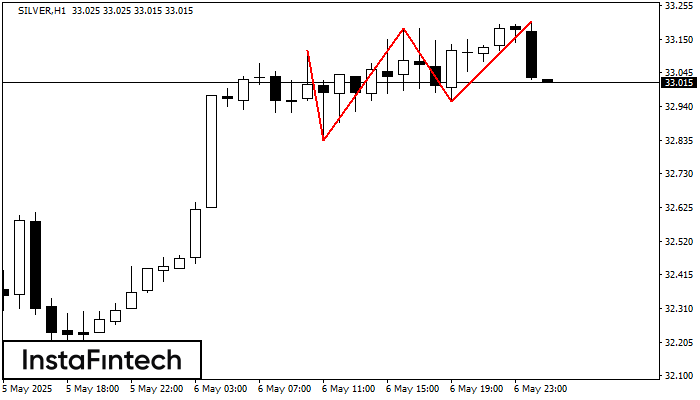
Pola Teratas Triple telah terbentuk pada grafik SILVER H1. Fitur-fitur pola: perbatasan memiliki sudut yang naik; batas bawah pola memiliki koordinat 32.84/32.95 dengan batas atas 33.12/33.20; proyeksi lebar adalah
Open chart in a new window


