

Pola sebenarnya

Double Bottom
was formed on 16.04 at 06:31:16 (UTC+0)
signal strength 2 of 5
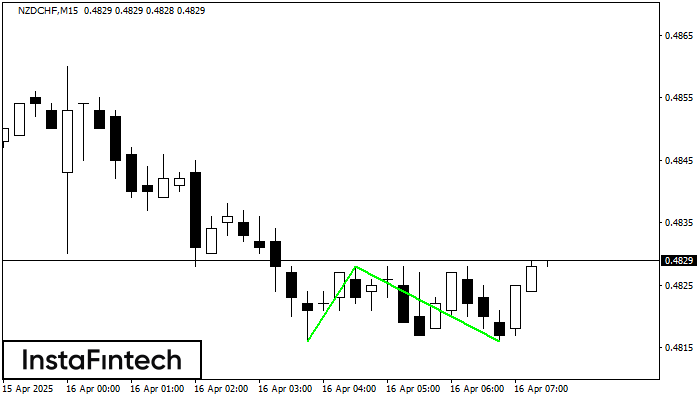
The Double Bottom pattern has been formed on NZDCHF M15; the upper boundary is 0.4828; the lower boundary is 0.4816. The width of the pattern is 12 points. In case of a break of the upper boundary 0.4828, a change in the trend can be predicted where the width of the pattern will coincide with the distance to a possible take profit level.
The M5 and M15 time frames may have more false entry points.
- All
- All
- Bearish Rectangle
- Bearish Symmetrical Triangle
- Bearish Symmetrical Triangle
- Bullish Rectangle
- Double Top
- Double Top
- Triple Bottom
- Triple Bottom
- Triple Top
- Triple Top
- All
- All
- Buy
- Sale
- All
- 1
- 2
- 3
- 4
- 5
Bawah Ganda
was formed on 08.05 at 20:50:21 (UTC+0)
signal strength 1 of 5
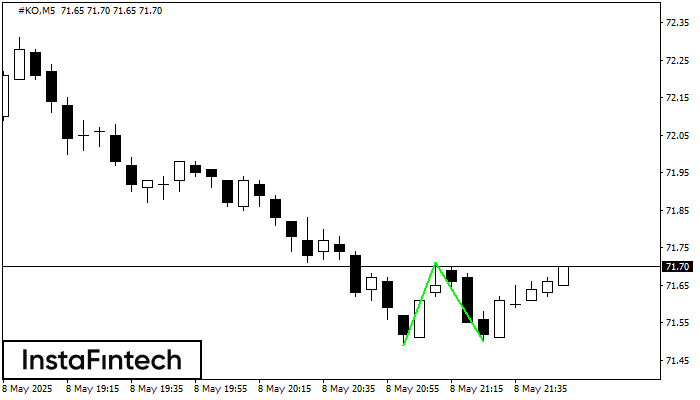
Pola Bawah Ganda telah terbentuk pada #KO M5; batas atas di 71.71; batas bawah di 71.50. Lebar pola sebesar 22 poin. Jika harga menembus batas atas 71.71, Perubahan dalam tren
Rangka waktu M5 dan M15 mungkin memiliki lebih dari titik entri yang keliru.
Open chart in a new window
Teratas Triple
was formed on 08.05 at 20:45:32 (UTC+0)
signal strength 1 of 5
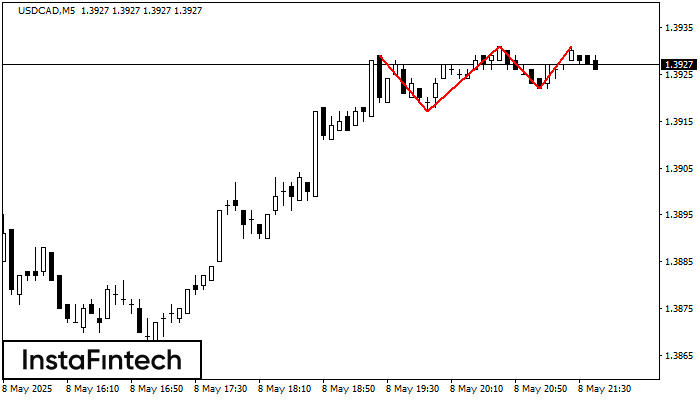
Pola Teratas Triple telah terbentuk pada grafik USDCAD M5. Fitur-fitur pola: perbatasan memiliki sudut yang naik; batas bawah pola memiliki koordinat 1.3917/1.3922 dengan batas atas 1.3929/1.3931; proyeksi lebar adalah
Rangka waktu M5 dan M15 mungkin memiliki lebih dari titik entri yang keliru.
Open chart in a new window
Bendera Bullish
was formed on 08.05 at 20:41:11 (UTC+0)
signal strength 1 of 5
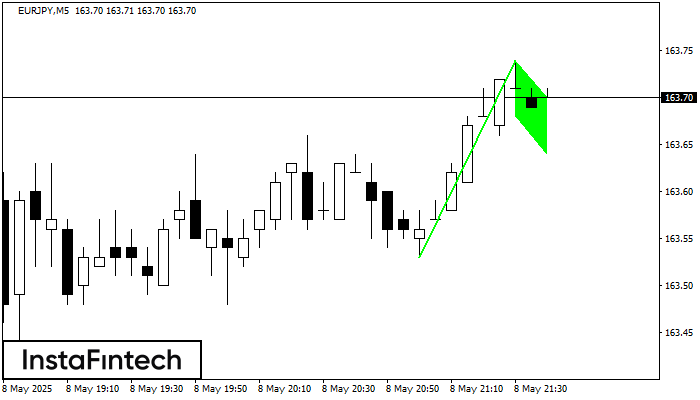
Pola Bendera Bullish telah terbentuk di grafik EURJPY M5, yang memberikan sinyal tren naik akan berlanjut. Sinyal: penembusan titik puncak di 163.74 mungkin mendorong harga lebih tinggi, dan kenaikan akan
Rangka waktu M5 dan M15 mungkin memiliki lebih dari titik entri yang keliru.
Open chart in a new window


