

Pola sebenarnya

Double Bottom
was formed on 16.04 at 05:05:29 (UTC+0)
signal strength 1 of 5
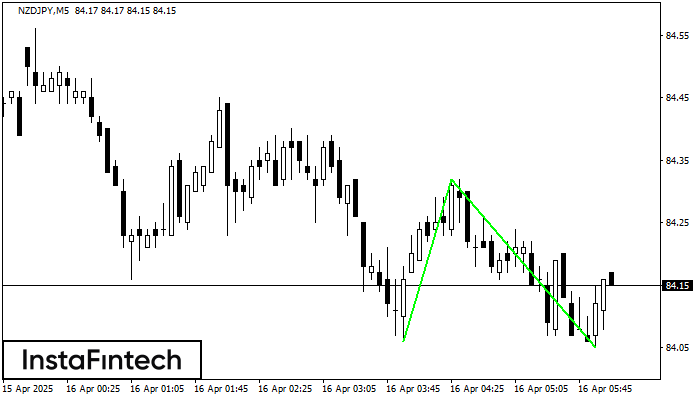
The Double Bottom pattern has been formed on NZDJPY M5. This formation signals a reversal of the trend from downwards to upwards. The signal is that a buy trade should be opened after the upper boundary of the pattern 84.32 is broken. The further movements will rely on the width of the current pattern 26 points.
The M5 and M15 time frames may have more false entry points.
- All
- All
- Bearish Rectangle
- Bearish Symmetrical Triangle
- Bearish Symmetrical Triangle
- Bullish Rectangle
- Double Top
- Double Top
- Triple Bottom
- Triple Bottom
- Triple Top
- Triple Top
- All
- All
- Buy
- Sale
- All
- 1
- 2
- 3
- 4
- 5
Bendera Bullish
was formed on 08.05 at 12:10:56 (UTC+0)
signal strength 2 of 5

Pola Bendera Bullish telah terbentuk di EURJPY at M15. Batas bawah pola ini terletak di 163.36/163.14, sementara batas atas terletak di 163.60/163.38. Proyeksi panjang jarum candle 62 poin. Pembentukan
Rangka waktu M5 dan M15 mungkin memiliki lebih dari titik entri yang keliru.
Open chart in a new window
Panji Bullish
was formed on 08.05 at 12:10:51 (UTC+0)
signal strength 2 of 5
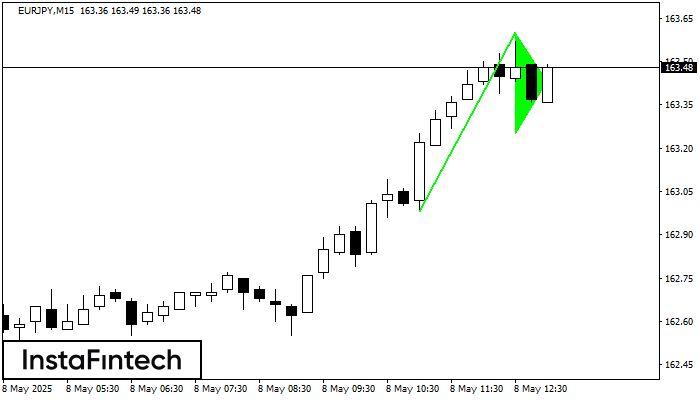
Pola grafik Panji Bullish telah terbentuk di instrumen EURJPY M15. Jenis pola ini terjadi pada kategori pola kelanjutan. Dalam kasus ini, jika kuotasi dapat menembus titik tertinggi, harga diperkirakan akan
Rangka waktu M5 dan M15 mungkin memiliki lebih dari titik entri yang keliru.
Open chart in a new window
Kepala dan Bahu Terbalik
was formed on 08.05 at 11:55:15 (UTC+0)
signal strength 1 of 5
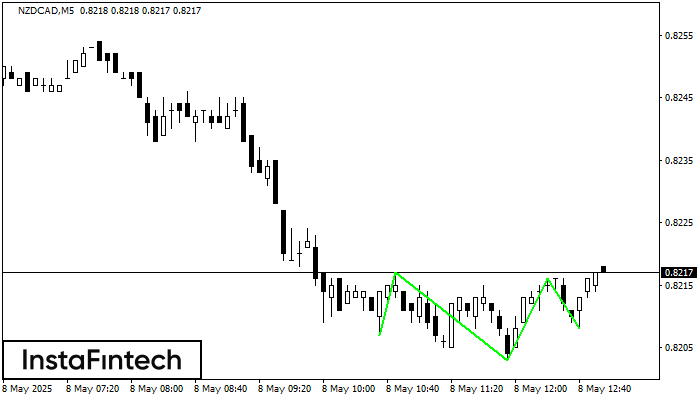
Menurut M5, NZDCAD membentuk pola teknikal – Kepala dan Bahu Terbalik. Jika garis leher (Neckline) 0.8217/0.8216 ditembus, maka instrumen ini kemungkinan akan bergerak menuju 0.8231
Rangka waktu M5 dan M15 mungkin memiliki lebih dari titik entri yang keliru.
Open chart in a new window


