

Pola sebenarnya

Bullish Symmetrical Triangle
was formed on 16.04 at 03:36:20 (UTC+0)
signal strength 2 of 5

According to the chart of M15, AUDCAD formed the Bullish Symmetrical Triangle pattern. The lower border of the pattern touches the coordinates 0.8796/0.8839 whereas the upper border goes across 0.8876/0.8839. If the Bullish Symmetrical Triangle pattern is in progress, this evidently signals a further upward trend. In other words, in case the scenario comes true, the price of AUDCAD will breach the upper border to head for 0.8862.
The M5 and M15 time frames may have more false entry points.
Lihat juga
- All
- All
- Bearish Rectangle
- Bearish Symmetrical Triangle
- Bearish Symmetrical Triangle
- Bullish Rectangle
- Double Top
- Double Top
- Triple Bottom
- Triple Bottom
- Triple Top
- Triple Top
- All
- All
- Buy
- Sale
- All
- 1
- 2
- 3
- 4
- 5
Teratas Ganda
was formed on 06.05 at 16:45:22 (UTC+0)
signal strength 1 of 5
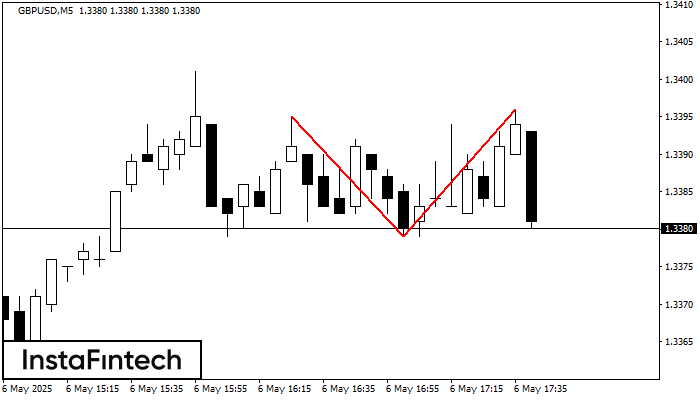
Pola reversal Teratas Ganda telah terbentuk pada GBPUSD M5. Karakteristik: batas atas 1.3395; batas bawah 1.3379; lebar pola 17 poin. Transaksi jual lebih baik dibuka di bawah batas bawah 1.3379
Rangka waktu M5 dan M15 mungkin memiliki lebih dari titik entri yang keliru.
Open chart in a new window
Teratas Ganda
was formed on 06.05 at 16:30:12 (UTC+0)
signal strength 1 of 5
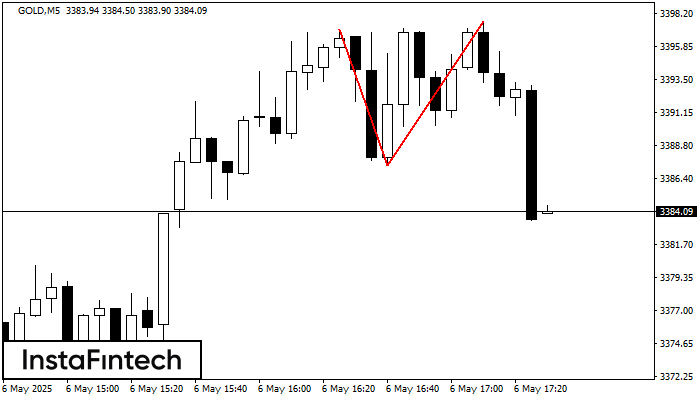
Pola reversal Teratas Ganda telah terbentuk pada GOLD M5. Karakteristik: batas atas 3397.08; batas bawah 3387.33; lebar pola 1031 poin. Transaksi jual lebih baik dibuka di bawah batas bawah 3387.33
Rangka waktu M5 dan M15 mungkin memiliki lebih dari titik entri yang keliru.
Open chart in a new window
Kepala dan Bahu Terbalik
was formed on 06.05 at 16:00:15 (UTC+0)
signal strength 3 of 5
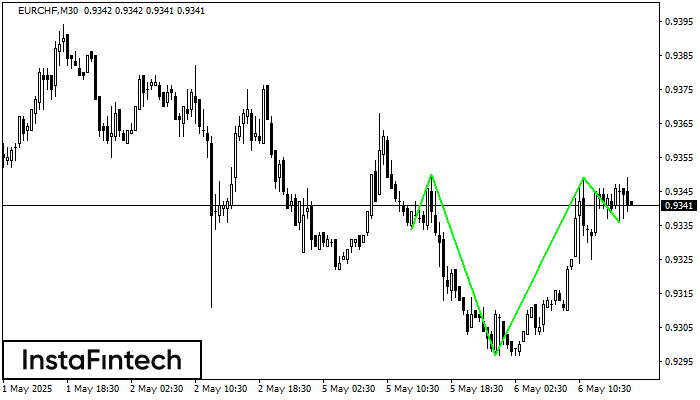
Menurut M30, EURCHF membentuk pola teknikal – Kepala dan Bahu Terbalik. Jika garis leher (Neckline) 0.9350/0.9349 ditembus, maka instrumen ini kemungkinan akan bergerak menuju 0.9379
Open chart in a new window


