

Pola sebenarnya

Double Bottom
was formed on 15.04 at 21:15:27 (UTC+0)
signal strength 2 of 5
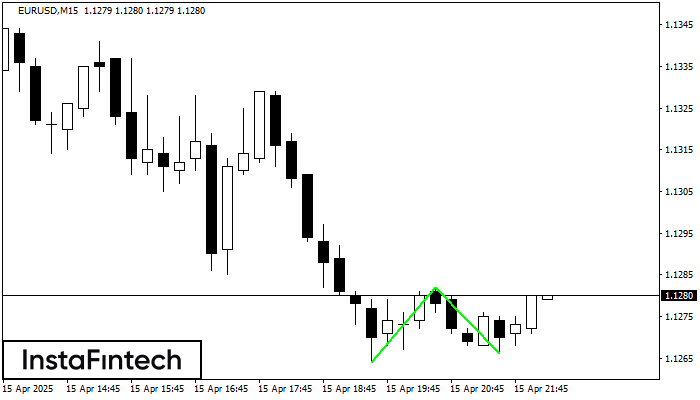
The Double Bottom pattern has been formed on EURUSD M15. Characteristics: the support level 1.1264; the resistance level 1.1282; the width of the pattern 18 points. If the resistance level is broken, a change in the trend can be predicted with the first target point lying at the distance of 16 points.
The M5 and M15 time frames may have more false entry points.
Lihat juga
- All
- All
- Bearish Rectangle
- Bearish Symmetrical Triangle
- Bearish Symmetrical Triangle
- Bullish Rectangle
- Double Top
- Double Top
- Triple Bottom
- Triple Bottom
- Triple Top
- Triple Top
- All
- All
- Buy
- Sale
- All
- 1
- 2
- 3
- 4
- 5
Triple Top
was formed on 22.04 at 02:00:16 (UTC+0)
signal strength 3 of 5

The Triple Top pattern has formed on the chart of the EURCAD M30 trading instrument. It is a reversal pattern featuring the following characteristics: resistance level 14, support level -60
Open chart in a new window
Bullish Symmetrical Triangle
was formed on 22.04 at 01:47:45 (UTC+0)
signal strength 2 of 5

According to the chart of M15, USDCAD formed the Bullish Symmetrical Triangle pattern, which signals the trend will continue. Description. The upper border of the pattern touches the coordinates 1.3848/1.3836
The M5 and M15 time frames may have more false entry points.
Open chart in a new window
Bullish Symmetrical Triangle
was formed on 22.04 at 01:45:28 (UTC+0)
signal strength 2 of 5

According to the chart of M15, NZDJPY formed the Bullish Symmetrical Triangle pattern. Description: This is the pattern of a trend continuation. 84.73 and 84.17 are the coordinates
The M5 and M15 time frames may have more false entry points.
Open chart in a new window


