

Pola sebenarnya

Bullish pennant
was formed on 15.04 at 20:46:24 (UTC+0)
signal strength 3 of 5
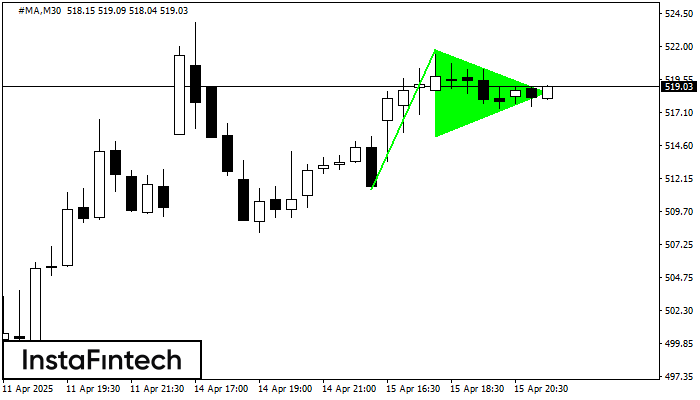
The Bullish pennant signal – Trading instrument #MA M30, continuation pattern. Forecast: it is possible to set up a buy position above the pattern’s high of 521.82, with the prospect of the next move being a projection of the flagpole height.
Lihat juga
- All
- All
- Bearish Rectangle
- Bearish Symmetrical Triangle
- Bearish Symmetrical Triangle
- Bullish Rectangle
- Double Top
- Double Top
- Triple Bottom
- Triple Bottom
- Triple Top
- Triple Top
- All
- All
- Buy
- Sale
- All
- 1
- 2
- 3
- 4
- 5
Double Bottom
was formed on 08.05 at 00:05:16 (UTC+0)
signal strength 1 of 5
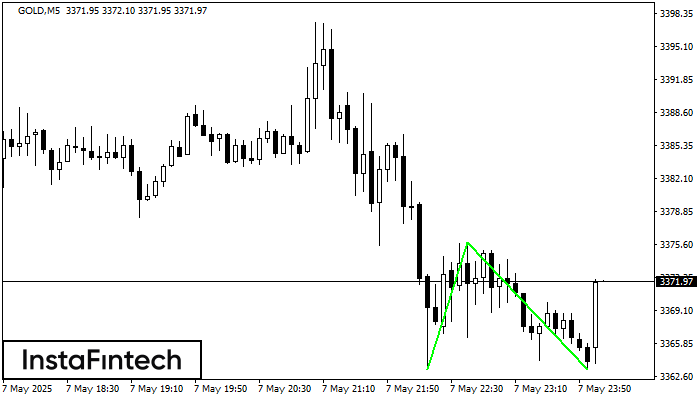
The Double Bottom pattern has been formed on GOLD M5; the upper boundary is 3375.87; the lower boundary is 3363.32. The width of the pattern is 1258 points. In case
The M5 and M15 time frames may have more false entry points.
Open chart in a new window
Triple Bottom
was formed on 07.05 at 23:25:32 (UTC+0)
signal strength 1 of 5
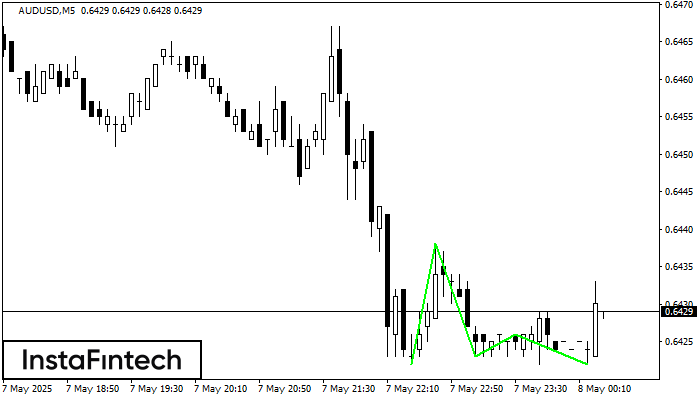
The Triple Bottom pattern has formed on the chart of AUDUSD M5. Features of the pattern: The lower line of the pattern has coordinates 0.6438 with the upper limit 0.6438/0.6426
The M5 and M15 time frames may have more false entry points.
Open chart in a new window
Double Bottom
was formed on 07.05 at 23:15:23 (UTC+0)
signal strength 2 of 5
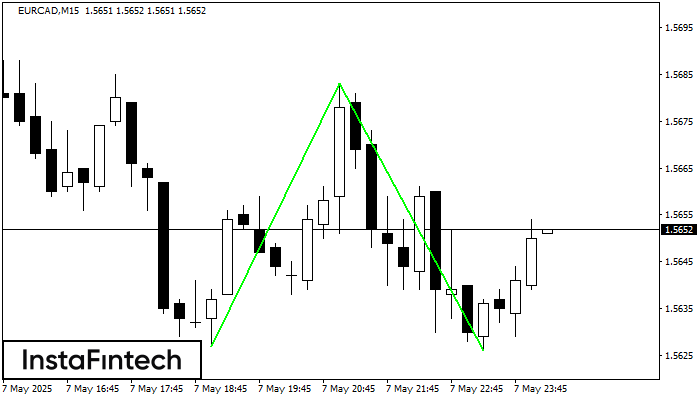
The Double Bottom pattern has been formed on EURCAD M15; the upper boundary is 1.5683; the lower boundary is 1.5626. The width of the pattern is 56 points. In case
The M5 and M15 time frames may have more false entry points.
Open chart in a new window


