

Pola sebenarnya

Bearish pennant
was formed on 14.04 at 20:46:59 (UTC+0)
signal strength 3 of 5

The Bearish pennant pattern has formed on the EURJPY M30 chart. It signals potential continuation of the existing trend. Specifications: the pattern’s bottom has the coordinate of 162.05; the projection of the flagpole height is equal to 88 pips. In case the price breaks out the pattern’s bottom of 162.05, the downtrend is expected to continue for further level 161.75.
Lihat juga
- All
- All
- Bearish Rectangle
- Bearish Symmetrical Triangle
- Bearish Symmetrical Triangle
- Bullish Rectangle
- Double Top
- Double Top
- Triple Bottom
- Triple Bottom
- Triple Top
- Triple Top
- All
- All
- Buy
- Sale
- All
- 1
- 2
- 3
- 4
- 5
Bullish Rectangle
was formed on 06.05 at 11:35:27 (UTC+0)
signal strength 1 of 5

According to the chart of M5, NZDCHF formed the Bullish Rectangle which is a pattern of a trend continuation. The pattern is contained within the following borders: the lower border
The M5 and M15 time frames may have more false entry points.
Open chart in a new window
Bullish Symmetrical Triangle
was formed on 06.05 at 10:54:33 (UTC+0)
signal strength 1 of 5
According to the chart of M5, USDCHF formed the Bullish Symmetrical Triangle pattern. The lower border of the pattern touches the coordinates 0.8219/0.8235 whereas the upper border goes across 0.8249/0.8235
The M5 and M15 time frames may have more false entry points.
Open chart in a new window
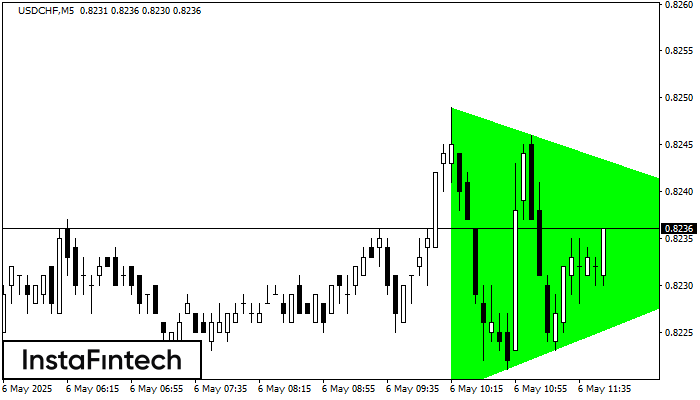
Bullish Symmetrical Triangle
was formed on 06.05 at 10:45:33 (UTC+0)
signal strength 1 of 5
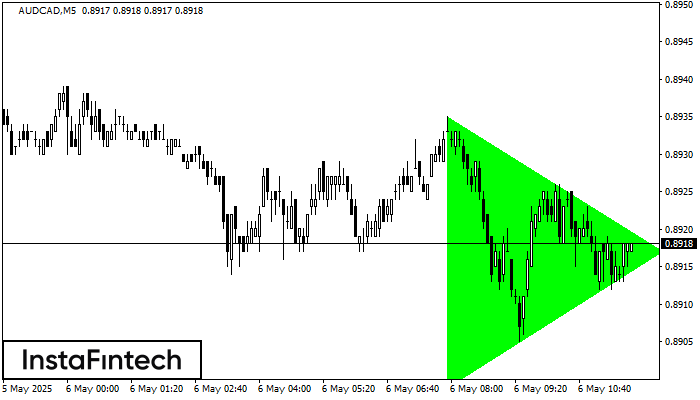
According to the chart of M5, AUDCAD formed the Bullish Symmetrical Triangle pattern. The lower border of the pattern touches the coordinates 0.8899/0.8917 whereas the upper border goes across 0.8935/0.8917
The M5 and M15 time frames may have more false entry points.
Open chart in a new window


