

Pola sebenarnya

Double Top
was formed on 14.04 at 18:25:23 (UTC+0)
signal strength 1 of 5
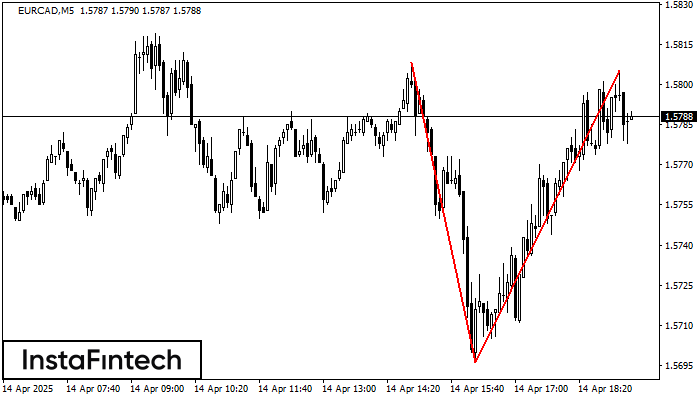
On the chart of EURCAD M5 the Double Top reversal pattern has been formed. Characteristics: the upper boundary 1.5805; the lower boundary 1.5696; the width of the pattern 109 points. The signal: a break of the lower boundary will cause continuation of the downward trend targeting the 1.5681 level.
The M5 and M15 time frames may have more false entry points.
- All
- All
- Bearish Rectangle
- Bearish Symmetrical Triangle
- Bearish Symmetrical Triangle
- Bullish Rectangle
- Double Top
- Double Top
- Triple Bottom
- Triple Bottom
- Triple Top
- Triple Top
- All
- All
- Buy
- Sale
- All
- 1
- 2
- 3
- 4
- 5
Bawah Triple
was formed on 06.05 at 03:00:35 (UTC+0)
signal strength 4 of 5

Pola Bawah Triple telah terbentuk pada GBPCHF H1. Pola tersebut memiliki karakteristik sebagai berikut: level resistance 1.0997/1.0988; level support 1.0919/1.0919; dengan lebar 78 poin. Jika terjadi pemecahan (breakdown) pada level
Open chart in a new window
Bawah Triple
was formed on 06.05 at 03:00:33 (UTC+0)
signal strength 4 of 5
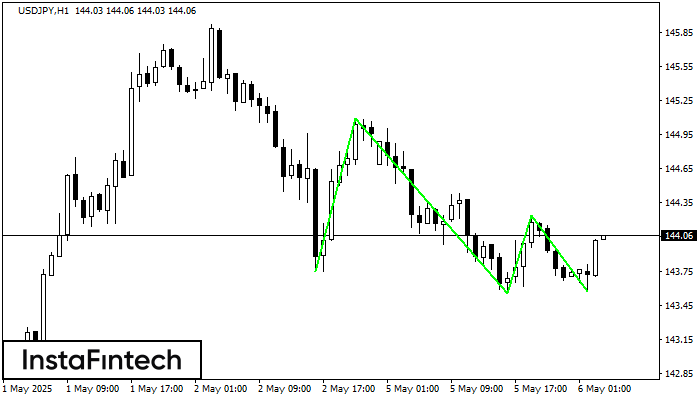
Pola Bawah Triple telah terbentuk pada grafik USDJPY H1. Fitur-fitur pola: garis bawah pola memiliki koordinat 145.09 dengan batas atas 145.09/144.24, proyeksi lebar adalah 134 poin. Pembentukan pola Bawah Triple
Open chart in a new window
Bawah Triple
was formed on 06.05 at 03:00:33 (UTC+0)
signal strength 4 of 5
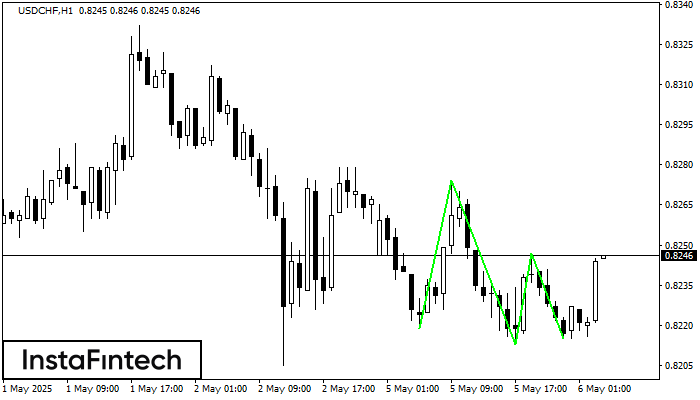
Pola Bawah Triple telah terbentuk pada grafik instrumen trading USDCHF H1. Pola tersebut menandakan perubahan dalam trend dari menurun menjadi naik jika terjadi pemecahan (breakdown) 0.8274/0.8247
Open chart in a new window


