

Pola sebenarnya

Triple Top
was formed on 14.04 at 15:00:11 (UTC+0)
signal strength 3 of 5
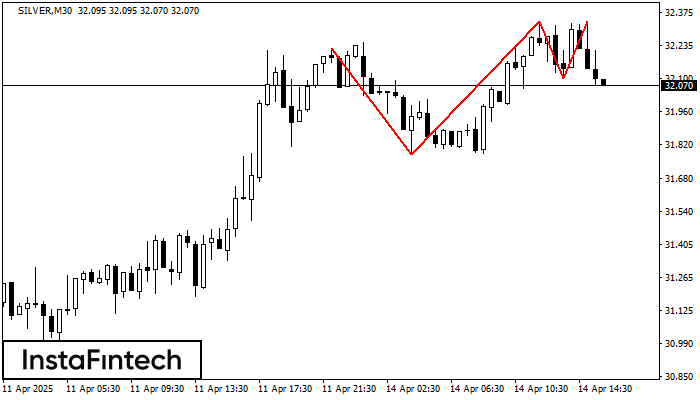
The Triple Top pattern has formed on the chart of the SILVER M30. Features of the pattern: borders have an ascending angle; the lower line of the pattern has the coordinates 31.78/32.10 with the upper limit 32.23/32.34; the projection of the width is 445 points. The formation of the Triple Top figure most likely indicates a change in the trend from upward to downward. This means that in the event of a breakdown of the support level of 31.78, the price is most likely to continue the downward movement.
- All
- All
- Bearish Rectangle
- Bearish Symmetrical Triangle
- Bearish Symmetrical Triangle
- Bullish Rectangle
- Double Top
- Double Top
- Triple Bottom
- Triple Bottom
- Triple Top
- Triple Top
- All
- All
- Buy
- Sale
- All
- 1
- 2
- 3
- 4
- 5
Triple Bottom
сформирован 05.05 в 10:00:09 (UTC+0)
сила сигнала 3 из 5
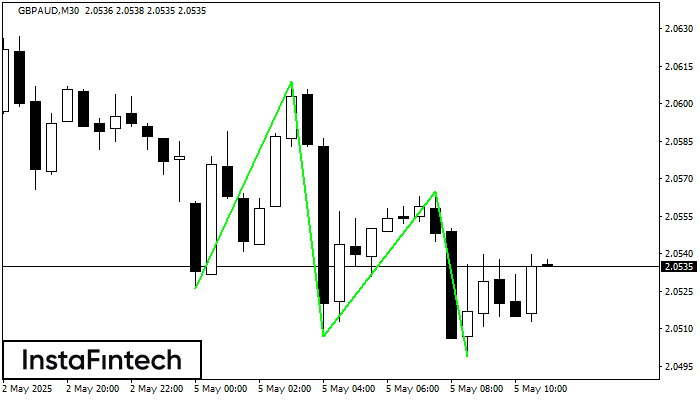
The Triple Bottom pattern has formed on the chart of GBPAUD M30. Features of the pattern: The lower line of the pattern has coordinates 2.0609 with the upper limit 2.0609/2.0565
Открыть график инструмента в новом окне
Double Top
сформирован 05.05 в 09:45:08 (UTC+0)
сила сигнала 1 из 5
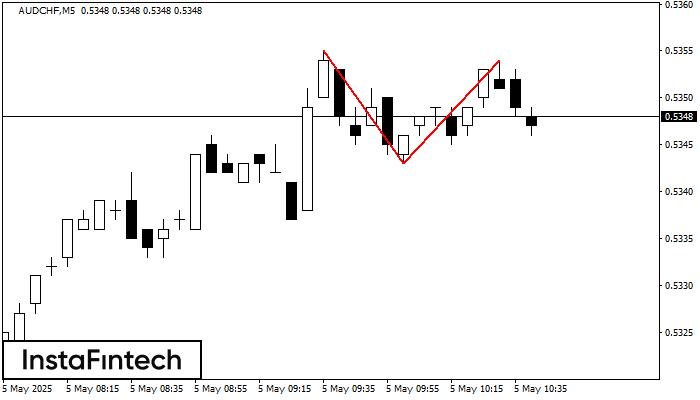
The Double Top reversal pattern has been formed on AUDCHF M5. Characteristics: the upper boundary 0.5355; the lower boundary 0.5343; the width of the pattern is 11 points. Sell trades
The M5 and M15 time frames may have more false entry points.
Открыть график инструмента в новом окне
Bullish Rectangle
сформирован 05.05 в 09:26:05 (UTC+0)
сила сигнала 1 из 5
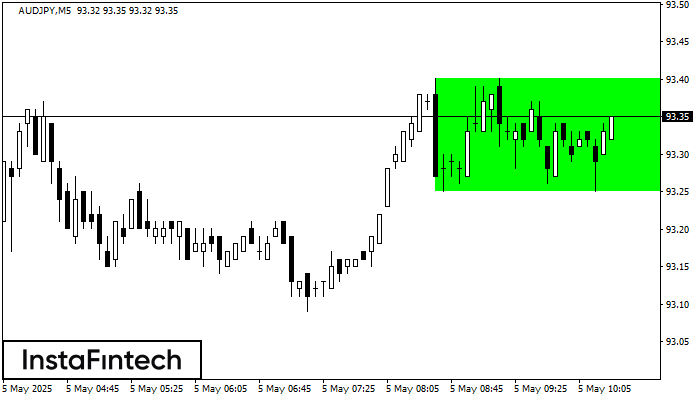
According to the chart of M5, AUDJPY formed the Bullish Rectangle. The pattern indicates a trend continuation. The upper border is 93.40, the lower border is 93.25. The signal means
The M5 and M15 time frames may have more false entry points.
Открыть график инструмента в новом окне


