

Pola sebenarnya

Double Bottom
was formed on 14.04 at 14:45:10 (UTC+0)
signal strength 1 of 5
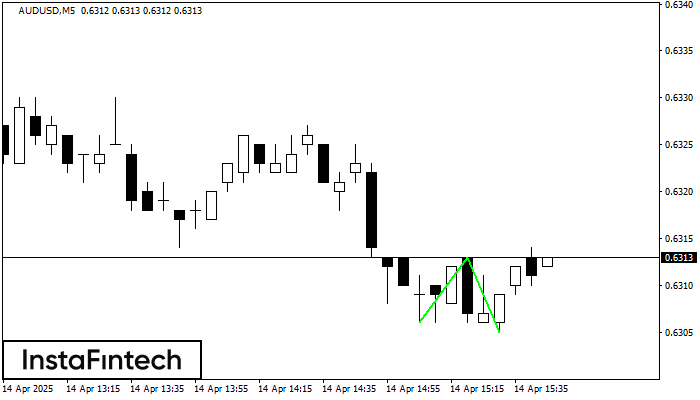
The Double Bottom pattern has been formed on AUDUSD M5; the upper boundary is 0.6313; the lower boundary is 0.6305. The width of the pattern is 7 points. In case of a break of the upper boundary 0.6313, a change in the trend can be predicted where the width of the pattern will coincide with the distance to a possible take profit level.
The M5 and M15 time frames may have more false entry points.
- All
- All
- Bearish Rectangle
- Bearish Symmetrical Triangle
- Bearish Symmetrical Triangle
- Bullish Rectangle
- Double Top
- Double Top
- Triple Bottom
- Triple Bottom
- Triple Top
- Triple Top
- All
- All
- Buy
- Sale
- All
- 1
- 2
- 3
- 4
- 5
Bearish Symmetrical Triangle
was formed on 04.05 at 09:04:31 (UTC+0)
signal strength 2 of 5

According to the chart of M15, #Bitcoin formed the Bearish Symmetrical Triangle pattern. Trading recommendations: A breach of the lower border 95528.76 is likely to encourage a continuation
The M5 and M15 time frames may have more false entry points.
Open chart in a new window
Bearish Rectangle
was formed on 04.05 at 00:51:55 (UTC+0)
signal strength 3 of 5

According to the chart of M30, #Bitcoin formed the Bearish Rectangle. This type of a pattern indicates a trend continuation. It consists of two levels: resistance 96456.78 - 0.00
Open chart in a new window
Double Bottom
was formed on 03.05 at 10:45:44 (UTC+0)
signal strength 2 of 5

The Double Bottom pattern has been formed on #Bitcoin M15. This formation signals a reversal of the trend from downwards to upwards. The signal is that a buy trade should
The M5 and M15 time frames may have more false entry points.
Open chart in a new window


