

Pola sebenarnya

Bullish Rectangle
was formed on 14.04 at 13:57:45 (UTC+0)
signal strength 1 of 5
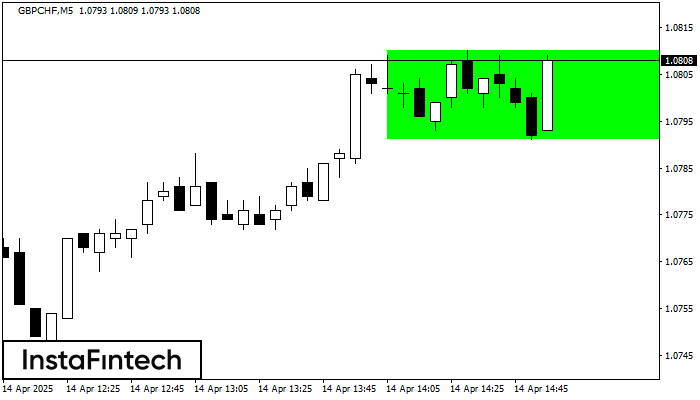
According to the chart of M5, GBPCHF formed the Bullish Rectangle. The pattern indicates a trend continuation. The upper border is 1.0810, the lower border is 1.0791. The signal means that a long position should be opened above the upper border 1.0810 of the Bullish Rectangle.
The M5 and M15 time frames may have more false entry points.
Lihat juga
- All
- All
- Bearish Rectangle
- Bearish Symmetrical Triangle
- Bearish Symmetrical Triangle
- Bullish Rectangle
- Double Top
- Double Top
- Triple Bottom
- Triple Bottom
- Triple Top
- Triple Top
- All
- All
- Buy
- Sale
- All
- 1
- 2
- 3
- 4
- 5
Bawah Ganda
was formed on 06.05 at 06:00:36 (UTC+0)
signal strength 2 of 5
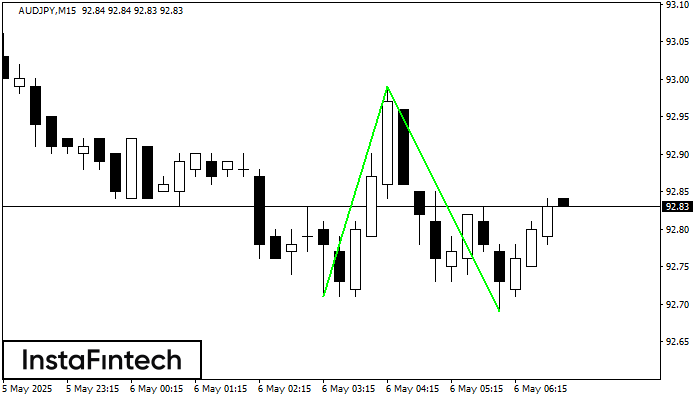
Pola Bawah Ganda telah terbentuk pada AUDJPY M15. Formasi ini mensinyalkan reversal tren dari arah penurunan ke arah kenaikan. Sinyal menunjukkan bahwa transaksi beli harus dibuka setelah batas atas pola
Rangka waktu M5 dan M15 mungkin memiliki lebih dari titik entri yang keliru.
Open chart in a new window
Bawah Ganda
was formed on 06.05 at 03:45:33 (UTC+0)
signal strength 1 of 5
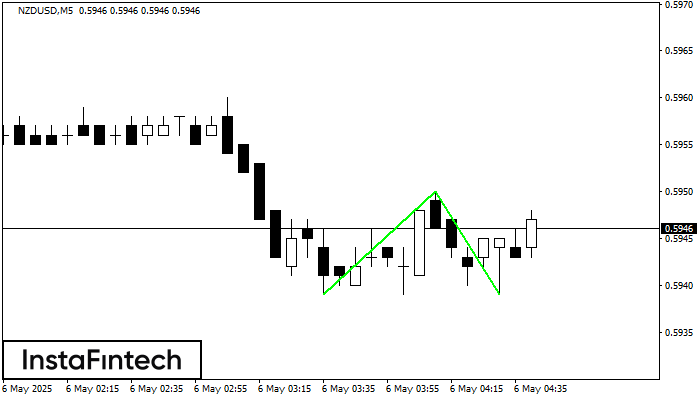
Pola Bawah Ganda telah terbentuk pada NZDUSD M5; batas atas di 0.5950; batas bawah di 0.5939. Lebar pola sebesar 11 poin. Jika harga menembus batas atas 0.5950, Perubahan dalam tren
Rangka waktu M5 dan M15 mungkin memiliki lebih dari titik entri yang keliru.
Open chart in a new window
Bawah Triple
was formed on 06.05 at 03:00:35 (UTC+0)
signal strength 4 of 5

Pola Bawah Triple telah terbentuk pada GBPCHF H1. Pola tersebut memiliki karakteristik sebagai berikut: level resistance 1.0997/1.0988; level support 1.0919/1.0919; dengan lebar 78 poin. Jika terjadi pemecahan (breakdown) pada level
Open chart in a new window


