

Pola sebenarnya

Bullish Rectangle
was formed on 14.04 at 13:29:26 (UTC+0)
signal strength 2 of 5
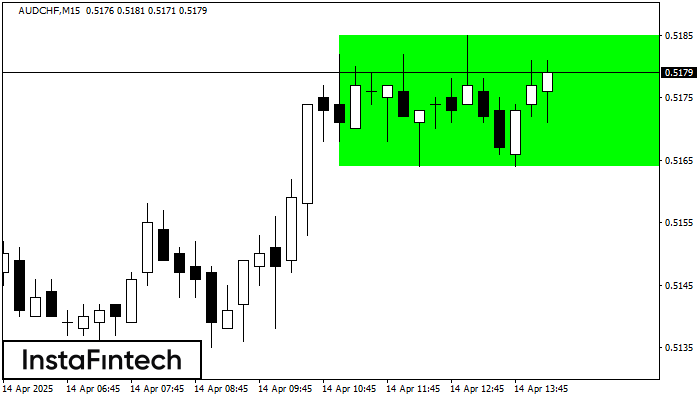
According to the chart of M15, AUDCHF formed the Bullish Rectangle which is a pattern of a trend continuation. The pattern is contained within the following borders: the lower border 0.5164 – 0.5164 and upper border 0.5185 – 0.5185. In case the upper border is broken, the instrument is likely to follow the upward trend.
The M5 and M15 time frames may have more false entry points.
Lihat juga
- All
- All
- Bearish Rectangle
- Bearish Symmetrical Triangle
- Bearish Symmetrical Triangle
- Bullish Rectangle
- Double Top
- Double Top
- Triple Bottom
- Triple Bottom
- Triple Top
- Triple Top
- All
- All
- Buy
- Sale
- All
- 1
- 2
- 3
- 4
- 5
Bearish Rectangle
was formed on 06.05 at 09:01:14 (UTC+0)
signal strength 4 of 5
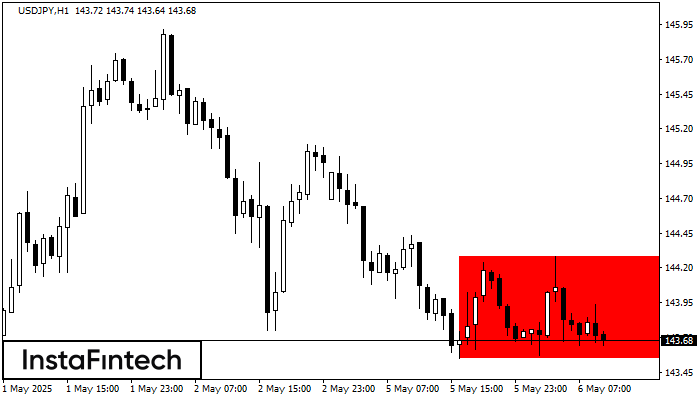
According to the chart of H1, USDJPY formed the Bearish Rectangle which is a pattern of a trend continuation. The pattern is contained within the following borders: lower border 143.55
Open chart in a new window
Bullish Symmetrical Triangle
was formed on 06.05 at 08:45:22 (UTC+0)
signal strength 1 of 5
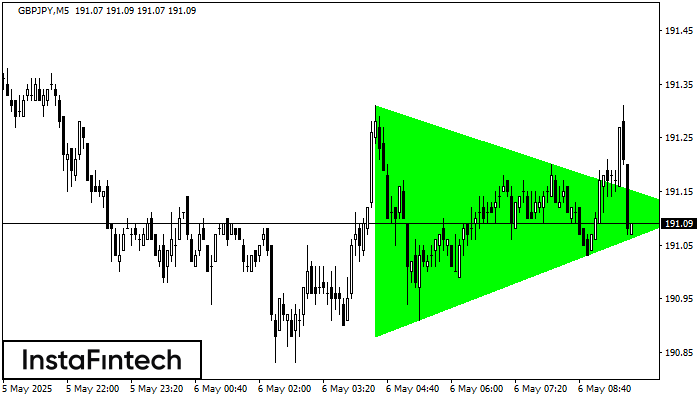
According to the chart of M5, GBPJPY formed the Bullish Symmetrical Triangle pattern. The lower border of the pattern touches the coordinates 190.88/191.11 whereas the upper border goes across 191.31/191.11
The M5 and M15 time frames may have more false entry points.
Open chart in a new window
Double Top
was formed on 06.05 at 08:00:10 (UTC+0)
signal strength 2 of 5
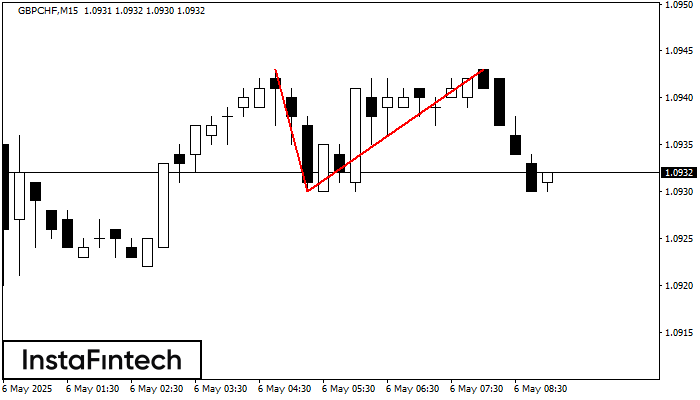
On the chart of GBPCHF M15 the Double Top reversal pattern has been formed. Characteristics: the upper boundary 1.0943; the lower boundary 1.0930; the width of the pattern 13 points
The M5 and M15 time frames may have more false entry points.
Open chart in a new window


